TODO: Use Mobile App
Prerequisites
We assume you have all prerequisites you may need, including:
- Get Access to Finmars
- Link with Finmars ID
- Install PMS Core or PMS Plus add-on
- How to Import Files in PMS Core and PMS Plus
- How to Do Calculations for YTM and Modified Duration
- How to Do Calculations for Performance (Modified Dietz)
- Calculate data for Mobile/Dashboards
Use Mobile App
Step 1. Download the Finmars App. The Finmars app is available on both the Google Play Store (for Android) and the App Store (for iOS). Download and install the app on your mobile device.
To use the app, you need to have an account on EU Central. You can sign up or log in at Central Finmars.
Step 2. Once you have an account, open the Finmars app, and you will see a "Welcome to Finmars" screen. Make sure to select "Europe (eu-central)" as your region. Then, tap the "LOGIN" button to proceed.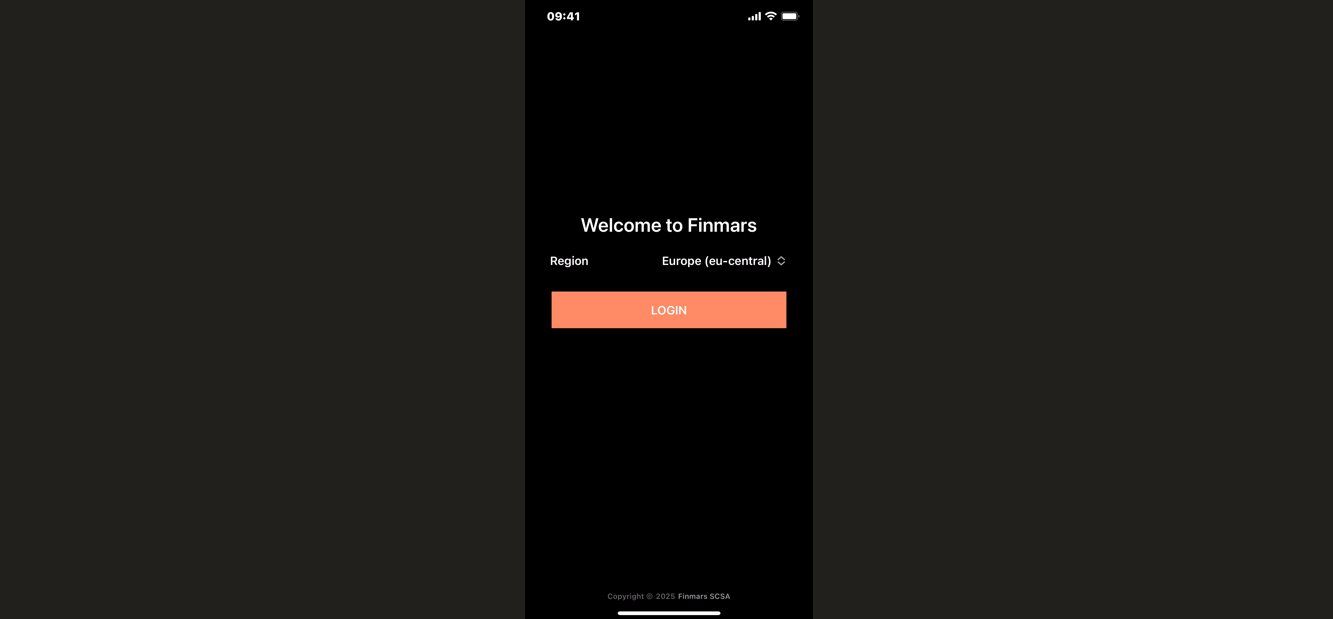
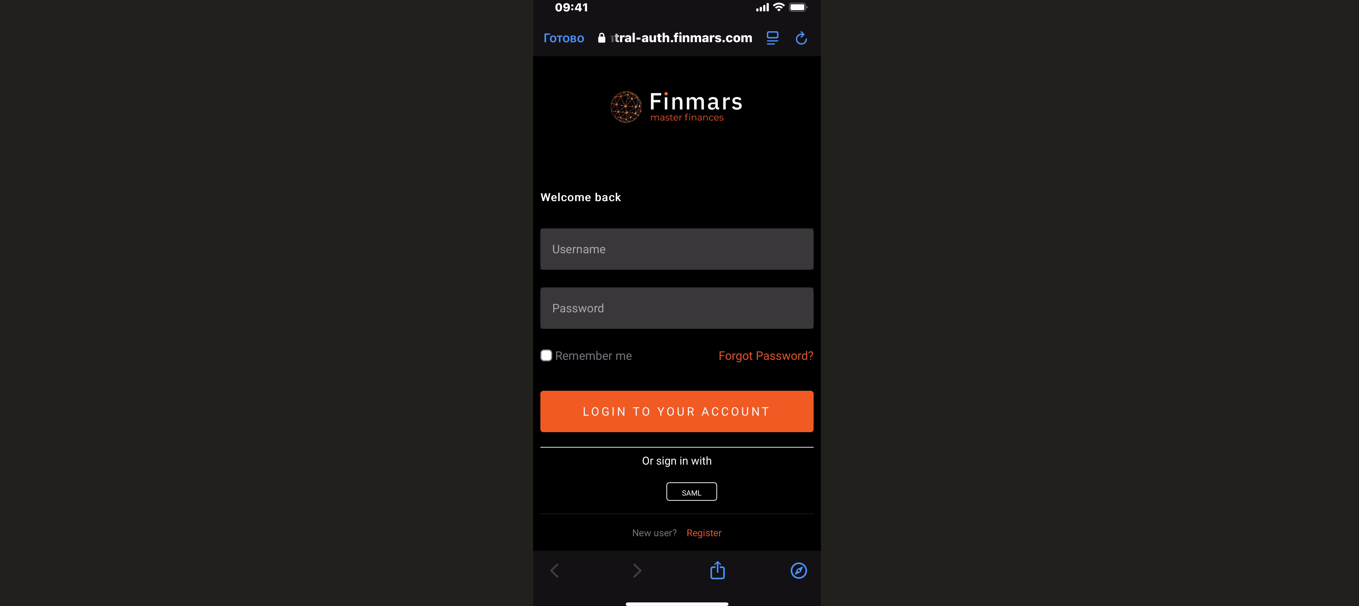
Step 3. After selecting the region, you will be redirected to the login page. Enter the Username and Password you used during registration. (Optional) Check "Remember me" if you want to stay logged in. Click the "LOGIN TO YOUR ACCOUNT" button to proceed.
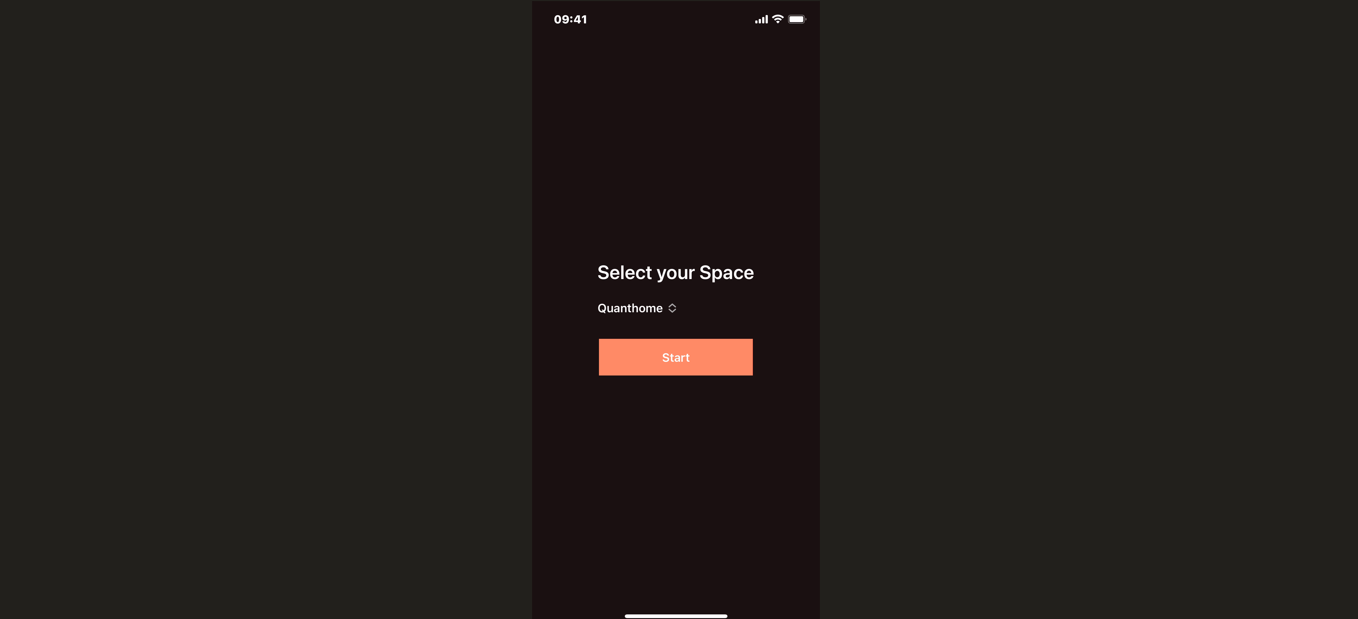
Step 4. After logging in, you will be redirected to the space selection page. Here, you will see a list of spaces that you have created in your workspace. Select the desired space from the list and click the "Start" button to proceed.
Step 5. After successfully logging in and selecting your workspace, you will be directed to the Balance tab. This is the main dashboard where you can view an overview of your investment portfolio and its distribution across different asset classes.
Main Page
After registering in Finmars, you will land on the main page, where you can find key information about your investment portfolio.
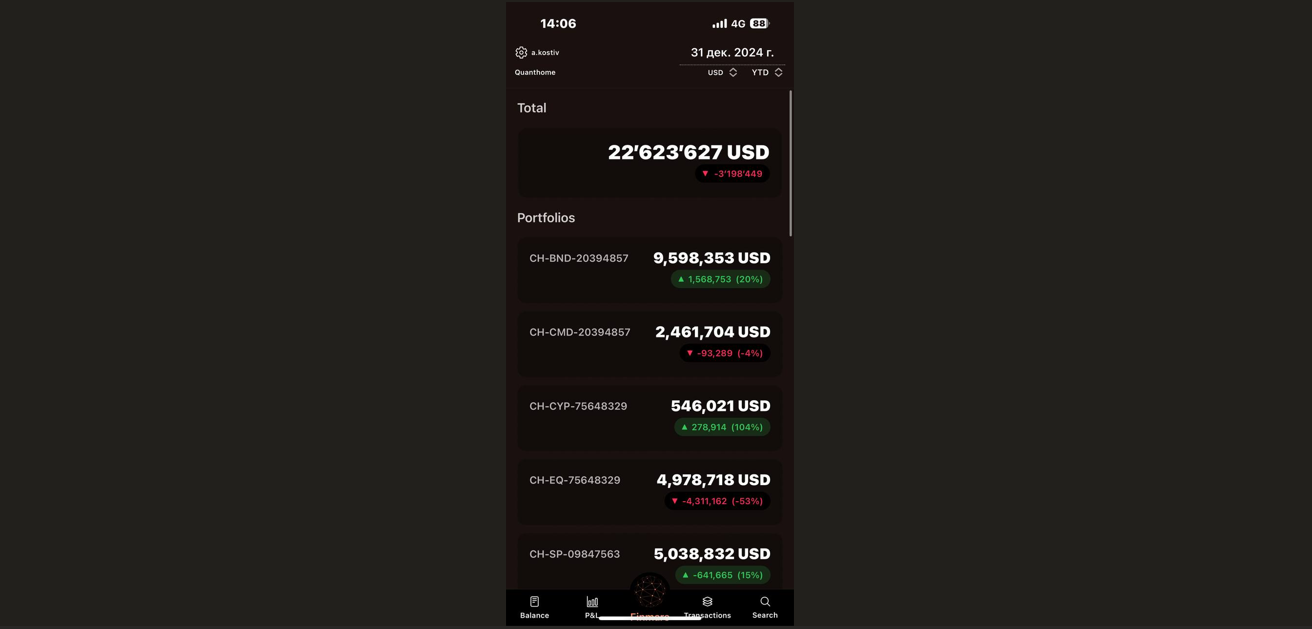
- In the top-right corner, you can adjust the report settings:
-
Report Date – Select the date for which you want to view data.
-
Currency – Choose the currency in which data will be displayed (USD, EUR, etc.).
-
Time Range Options:
-
YTD – Year-to-date
-
MTD – Month-to-date
-
QTD – Quarter-to-date
-
Daily – Current day
-
All time – Entire history
-
Custom – Set your own period
-
-
- "Total" Section-displays the total value of all your assets.
- "Portfolios" Section-lists all your active portfolios along with their current value.
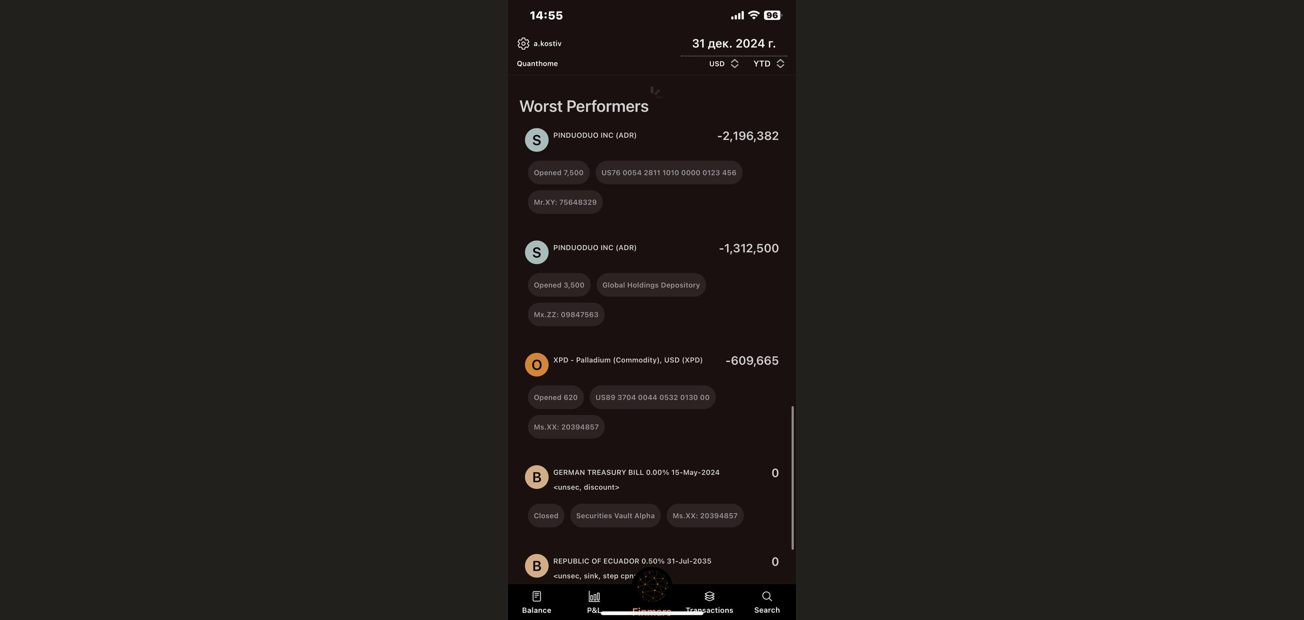
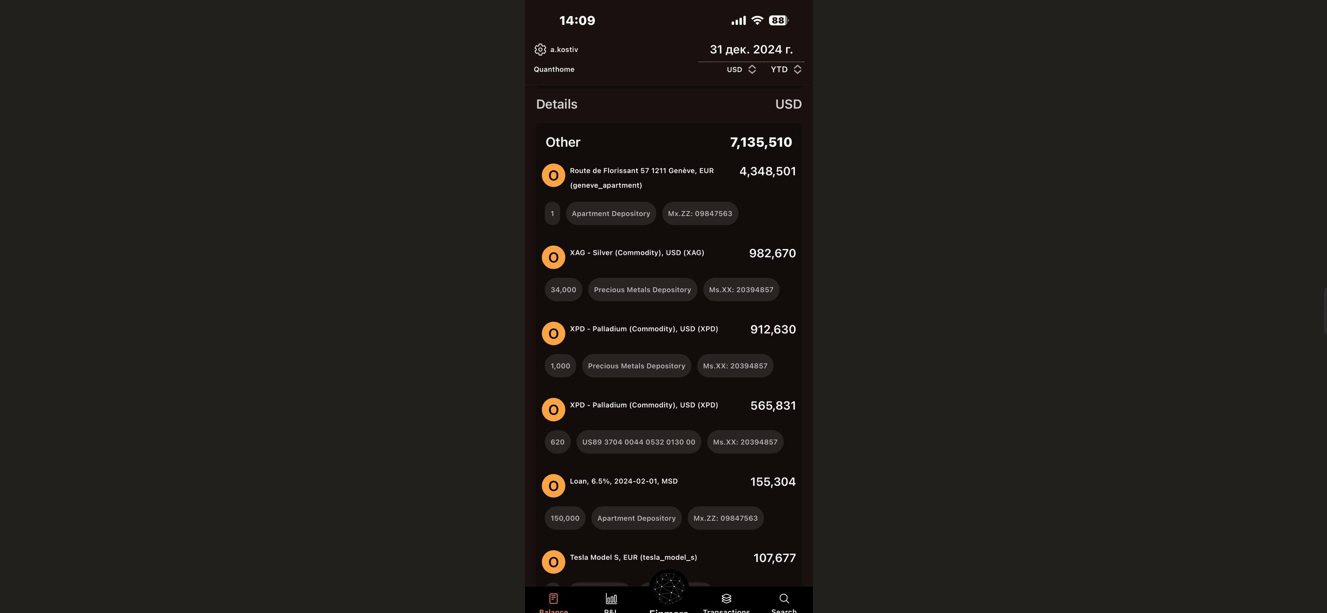
- "Worst Performers" Section-highlights the investments that have performed the worst over the selected period. Each position includes:
-
Asset name (e.g., Pinduoduo Inc, Palladium USD, etc.)
-
Current loss (negative value)
-
Position size (e.g., 7,500 shares)
-
Depository or account type
-
Unique position identifier
-
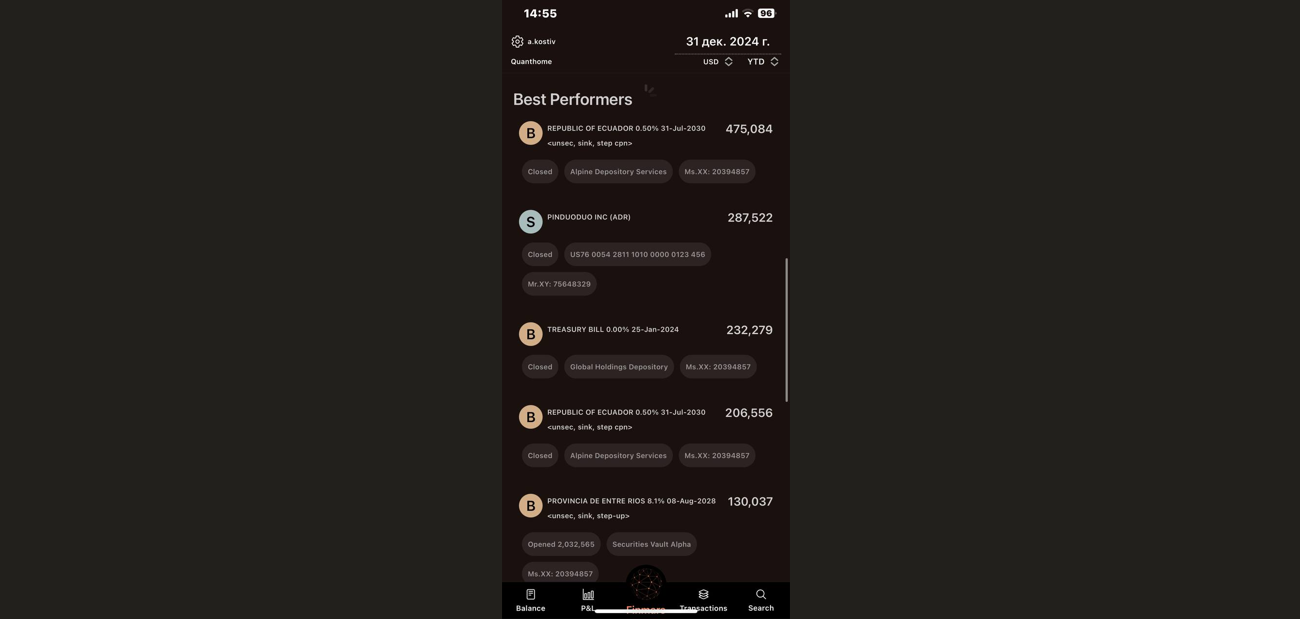
- "Best Performers" Section. This section showcases the assets that have generated the highest returns.
-
Asset name
-
Current profit (positive value)
-
Position size
-
Depository or account type
-
Unique position identifier
-
Settings Menu
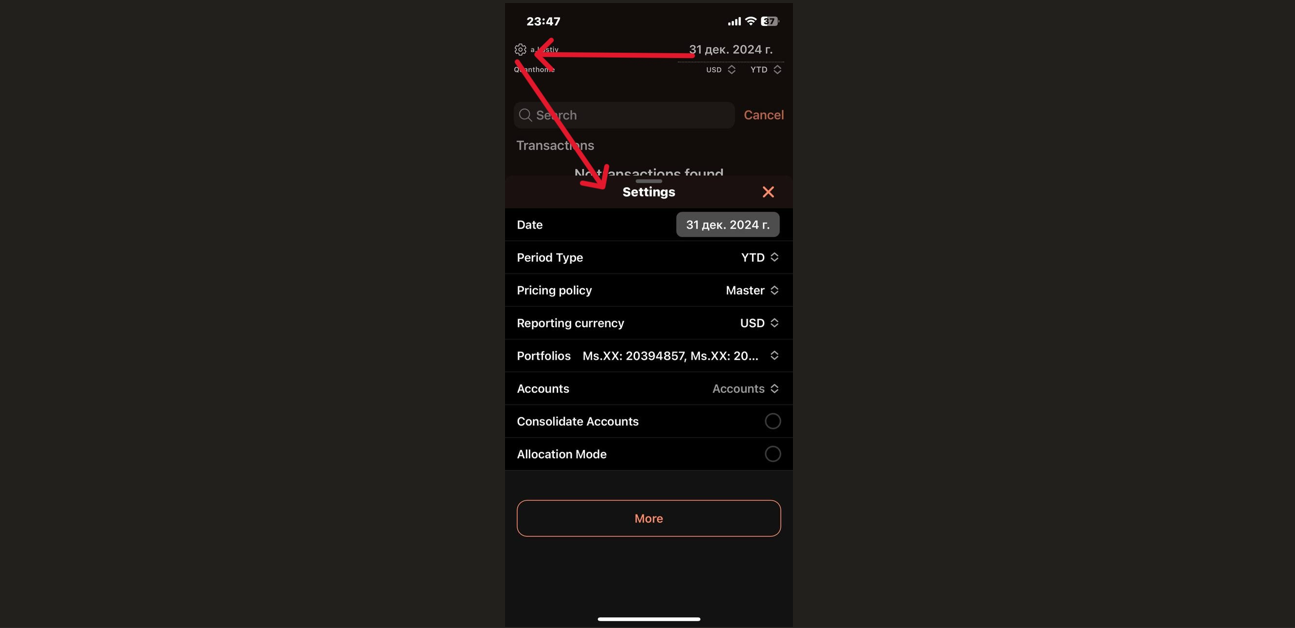
- Date Selection- choose a specific date for generating financial reports.
- Period Type- select reporting periods such as YTD (Year-to-Date), MTD (Month-to-Date), QTD (Quarter-to-Date), Daily or All-Time.
- Pricing policy- define how asset pricing is calculated (Master or other policies).
- Reporting Currency- set the preferred currency for displaying portfolio values (USD, EUR, etc.).
- Portfolio & Accounts Management:
-
View and manage multiple portfolios and accounts in one place.
-
Option to consolidate accounts for an aggregated financial view.
-
- Additional Settings- more customization options available via the “More” button.
The Balance Tab
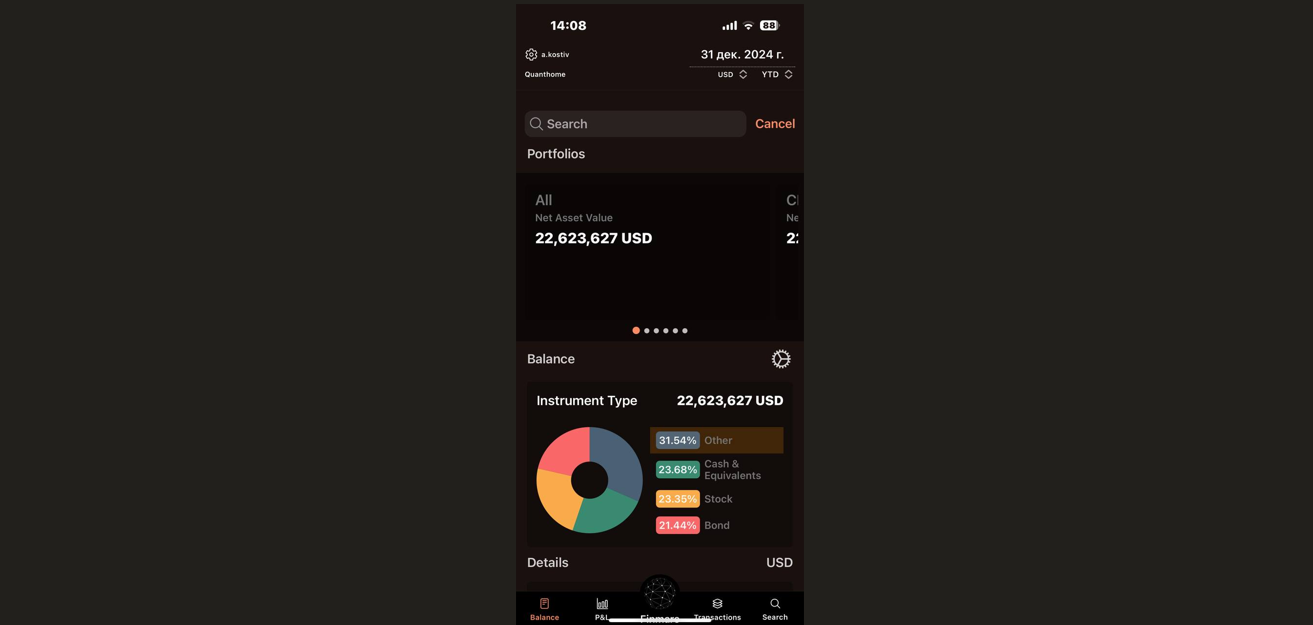
The Balance tab consists of the following sections:
The P&L Tab
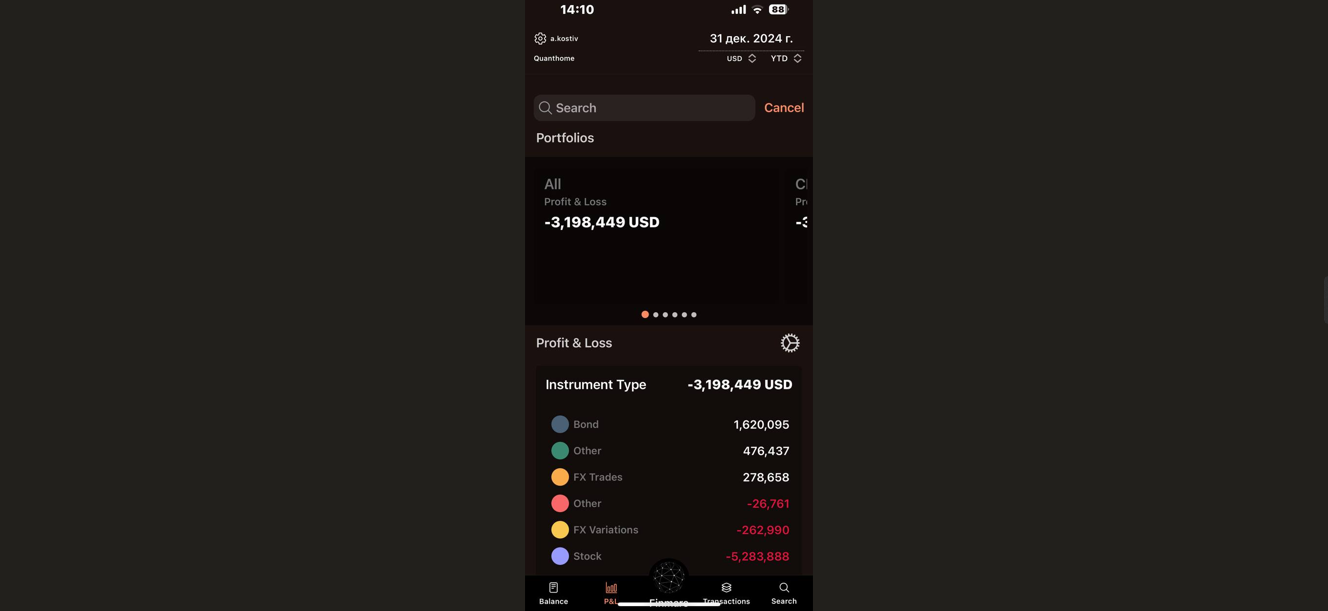
- Portfolio Overview- displays a list of portfolios along with their respective Profit & Loss values.
- Metrics Section- shows key performance indicators for the selected date.
At the top of the screen, you can modify:
-
Date of the report – Adjust to a different reporting period.
-
Currency – Change the display currency (e.g., USD, EUR, etc.).
-
Performance period – Adjust the timeframe (e.g., YTD - Year to Date).
Transactions Tab
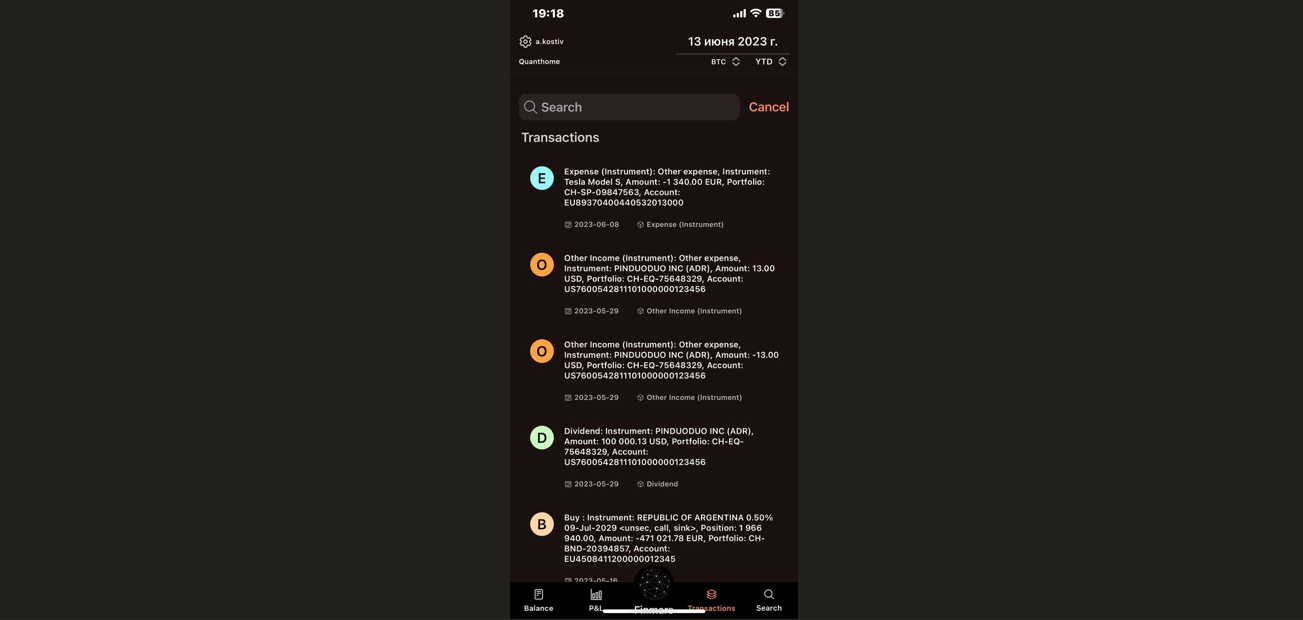
The Transactions tab in Finmars provides a detailed history of all financial activities within your investment portfolios. This section helps you track every expense, income, dividend, or trade in a structured format.
At the top of the screen, you will find a search bar that allows you to filter transactions based on keywords such as:
-
Asset name (e.g., "Tesla Model S", "PINDUODUO INC")
-
Transaction type (e.g., "Dividend", "Buy", "Expense")
-
Portfolio or account numbers
Transaction Type:
-
E (Blue) – Expense (e.g., fees, withdrawals, asset depreciation)
-
O (Orange) – Other Income (e.g., interest payments, refunds)
-
D (Green) – Dividend (profit distribution from stocks)
-
B (Brown) – Buy (purchase of an asset)
Detailed Transaction Information:
-
Instrument (Asset Name) – The name of the stock, bond, or other financial instrument (e.g., "Tesla Model S", "PINDUODUO INC (ADR)").
-
Amount – The transaction amount, including the currency (e.g., -1,340.00 EUR, 13.00 USD).
-
Portfolio & Account Number – The unique identifiers for the portfolio and account associated with the transaction.
-
Date – The date the transaction was executed (e.g., "2023-06-08").
Search Tab
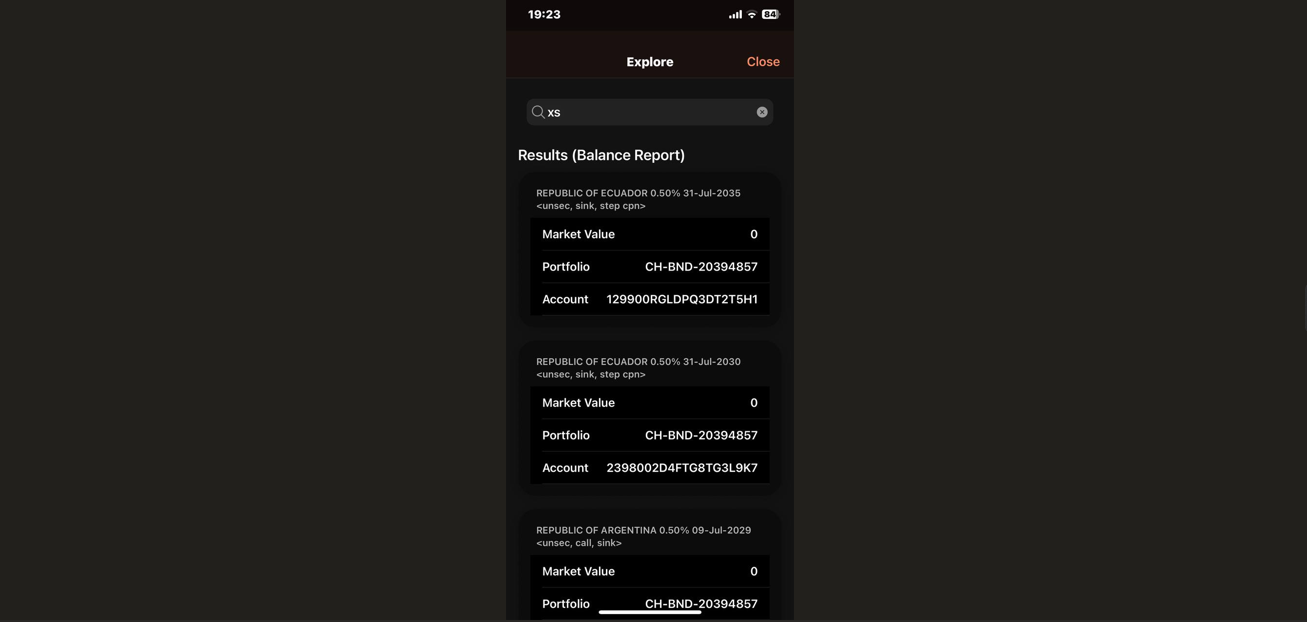
The Search tab in Finmars allows users to quickly find specific assets, transactions, or reports across their portfolios. This feature provides an efficient way to navigate large datasets and locate relevant financial details.
-
It enables users to enter keywords such as asset names, portfolio IDs, account numbers, or transaction types.
-
As you type, results dynamically update to match your query.