Check Performance Report
Prerequisites
We assume you have all prerequisites you may need, including:
- Get Access to Finmars
- Link with Finmars ID
- Install PMS Core or PMS Plus add-on
- How to Import Files in PMS Core and PMS Plus
- How to Do Calculations for YTM and Modified Duration (if you need YTM & Modified Duration)
- How to Do Calculations for Performance (Modified Dietz)
Check Performance Report
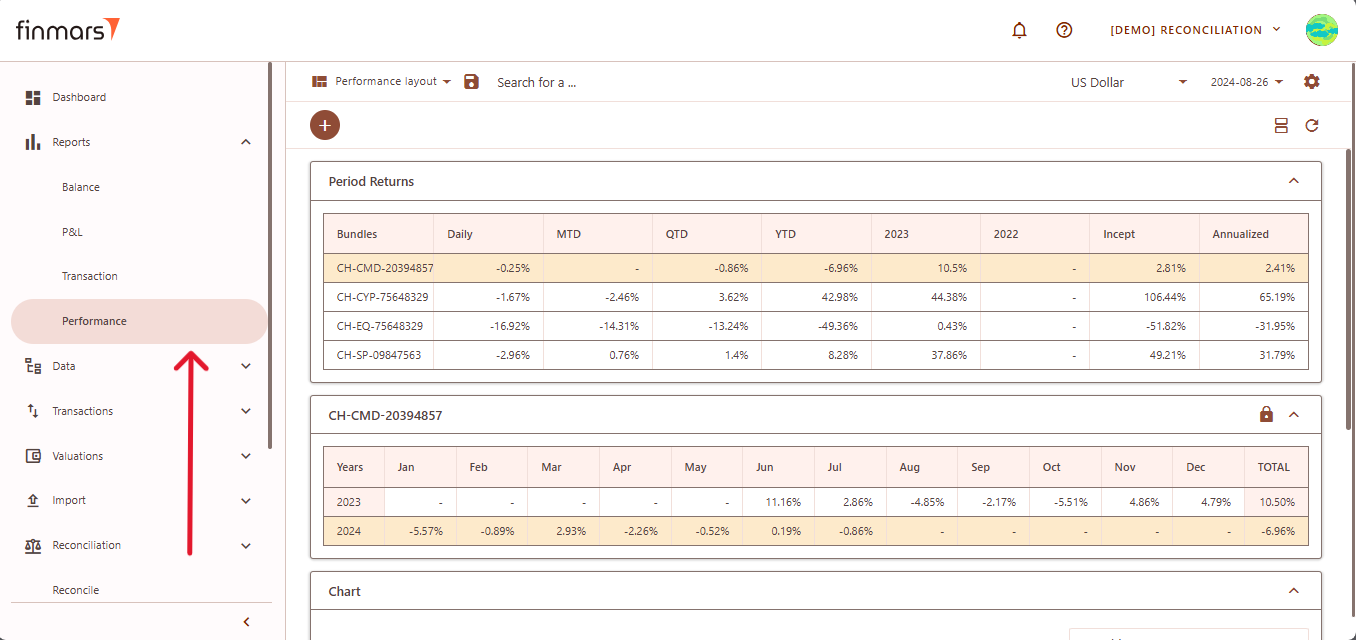
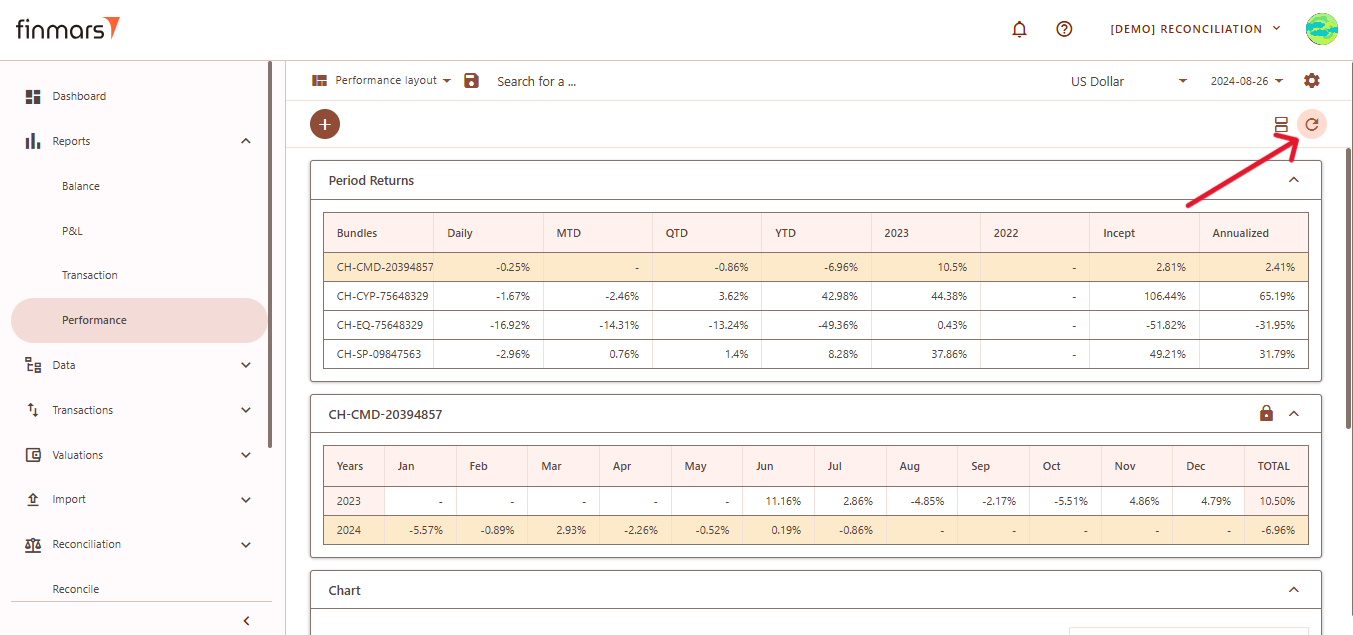
- Go to the left sidebar. Locate and select the Report section and click on Performance. Ensure that the correct layout is selected from the dropdown in the upper-left corner. If the wrong layout is selected, change it before proceeding.

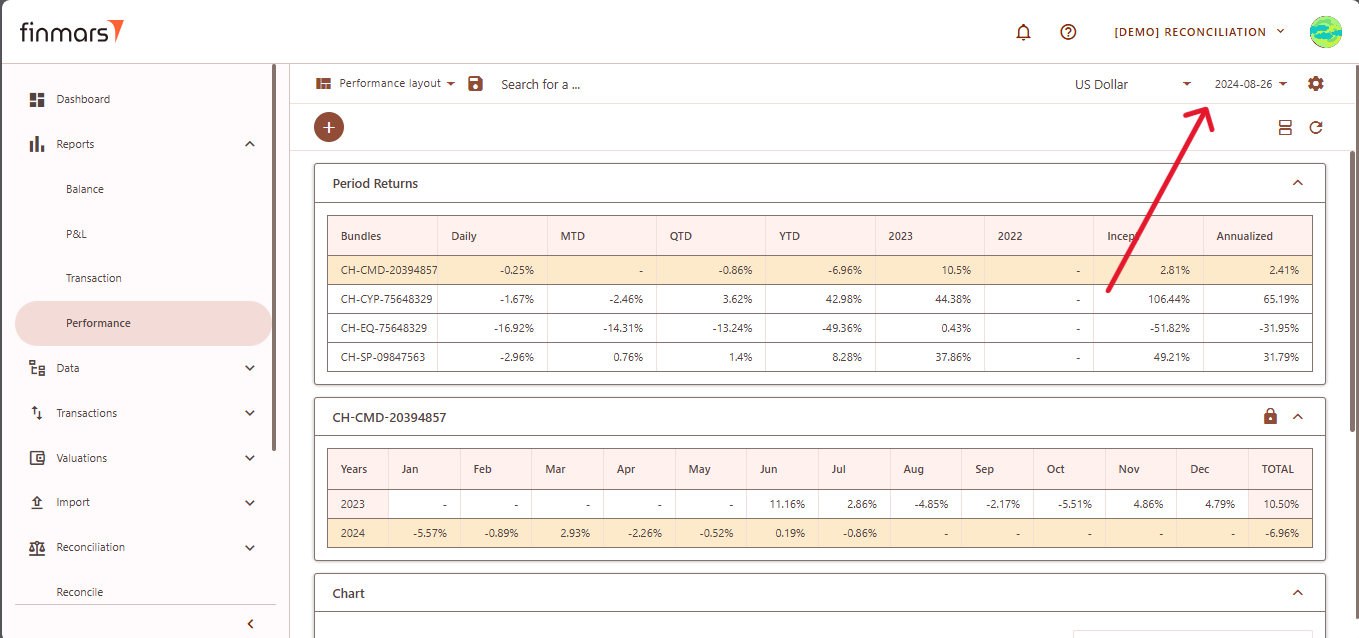
- Once on the Performance page, adjust the settings according to your reporting needs. Сonfirm the Currency in the top panel. Also, verify that the Report Date is set correctly. The system displays the balance as of the end of the selected day. This setting should always be used to reflect accurate financial data.

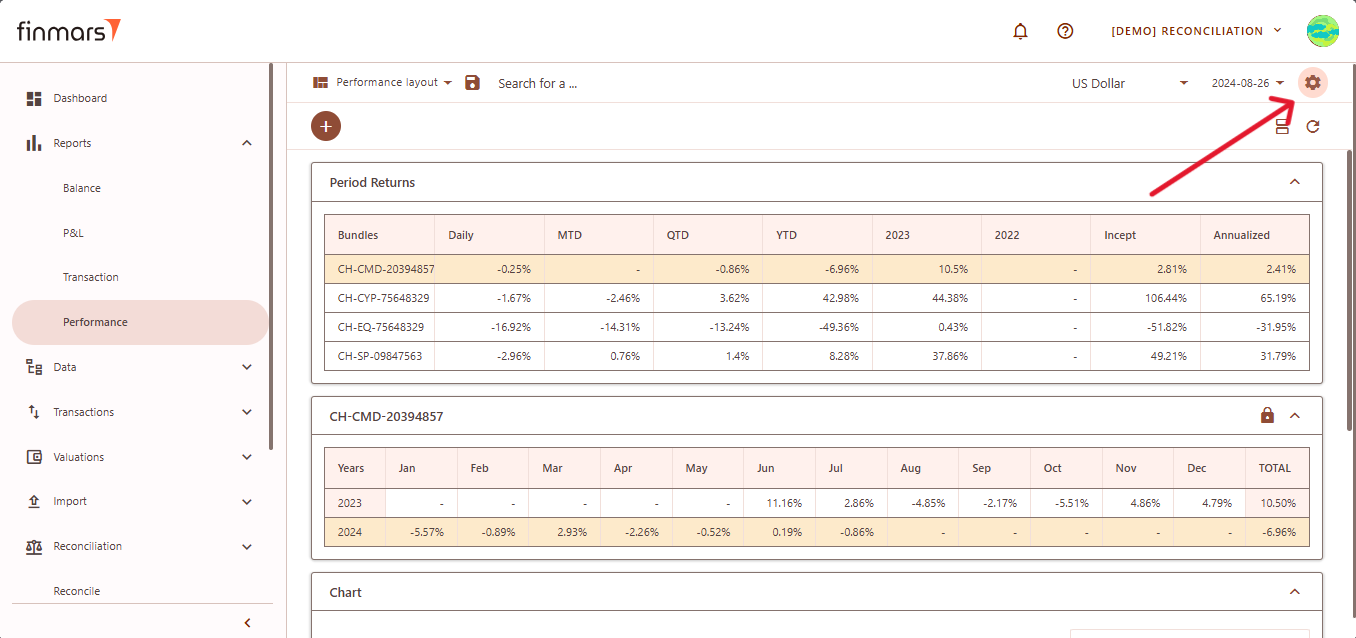
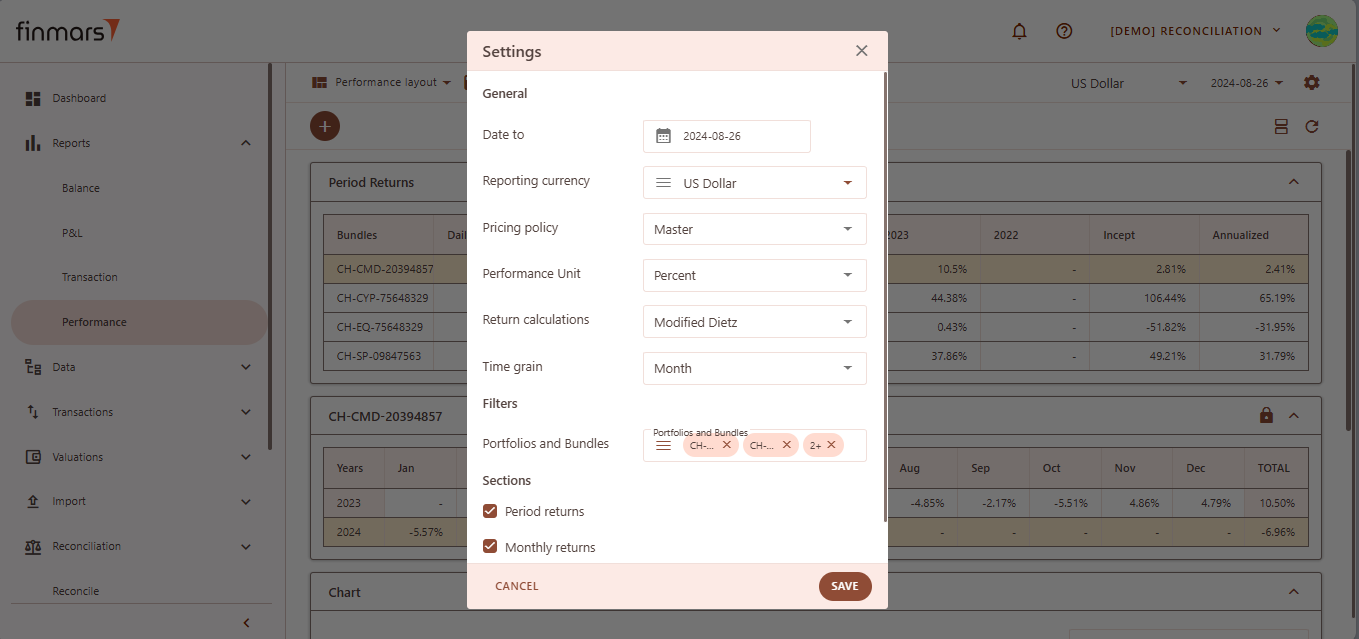
- If you want to configure more detailed report settings, click on the gear icon in the top-right corner to open the settings panel.
- Set the Cost Method (such as AVCO or FIFO).
- Define the Pricing Policy to determine how asset values are calculated (When selecting the Pricing Policy, you are choosing the set of prices and exchange rates to be applied.)
- In the Performance Unit, select whether you want the report to display performance in Percent or Absolute terms.
- Choose the method for return calculations by selecting Modified Dietz.
- Set the Time grain to define the period for performance calculations, such as daily or monthly.
- If you need to filter the report to specific portfolios or bundles, click on the Portfolios and Bundles field and select the relevant items.
- In the Sections area, select the components you want to include in the report, such as:
- Period Returns ( Displays performance returns for different periods such as Daily, MTD, QTD, YTD, and historical years),
- Monthly Returns (Breaks down performance data into monthly periods for more granular analysis.).
- Graphs (Enables visual representation of performance).
- After adjusting these settings, confirm by clicking OK.
- To apply the selected settings and view the updated report, simply refresh the page. Once refreshed, the report will be displayed with the updated parameters, reflecting the selected configurations.
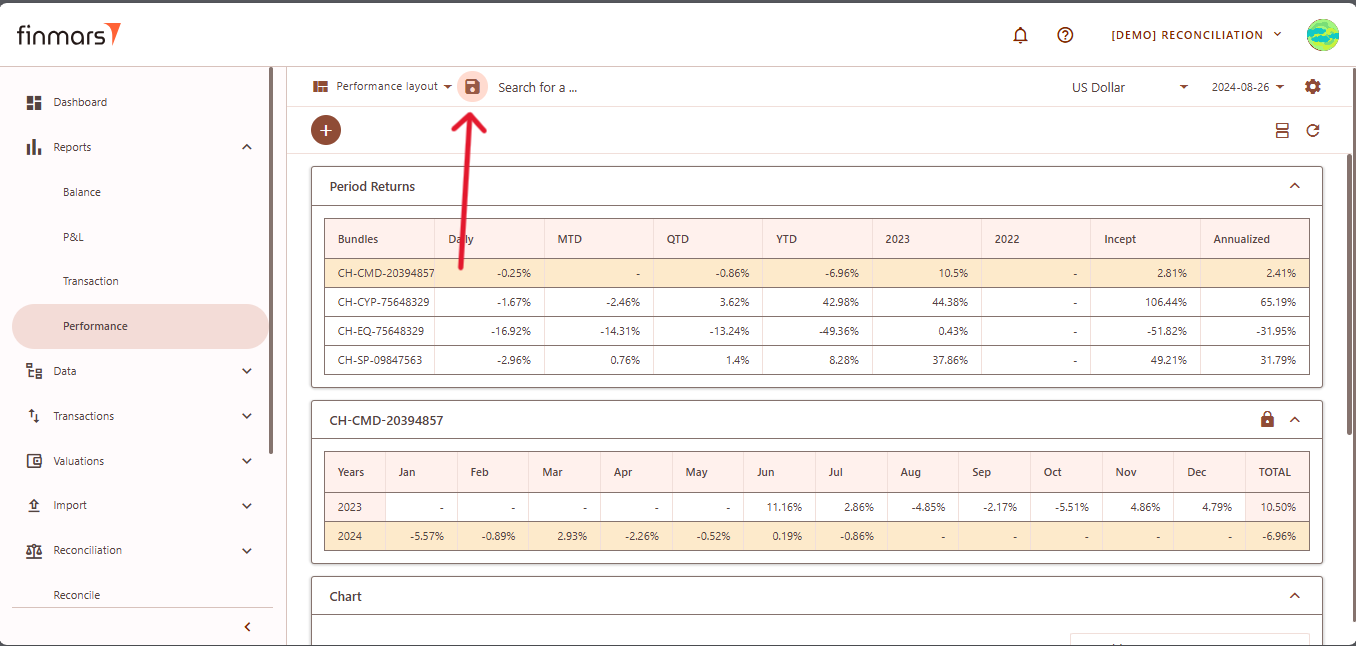
- After verifying the report, you can either save it within the system for future reference. To do this, locate the Save button, which is positioned in the upper-left corner of the report interface. Clicking this button will store the current report layout and data for future access. It’s important to use the standard settings whenever possible to maintain consistency. If changes are needed, create a duplicate of the layout and save it locally to avoid potential data loss during updates or reinstallation of marketplace modules.