How to Check Standard Dashboards
Prerequisites
We assume you have all prerequisites you may need, including:
- If needed: the VPN is configured to access the Finmars resources
- If needed: access to the Virtual Machine to work with the sensitive information
- Must have: registered in Finmars in the needed region environment (self-registered or registered by Finmars)
- Must have: having permissions set to allow continue with the Action in the Guide
Checking Standard Dashboards
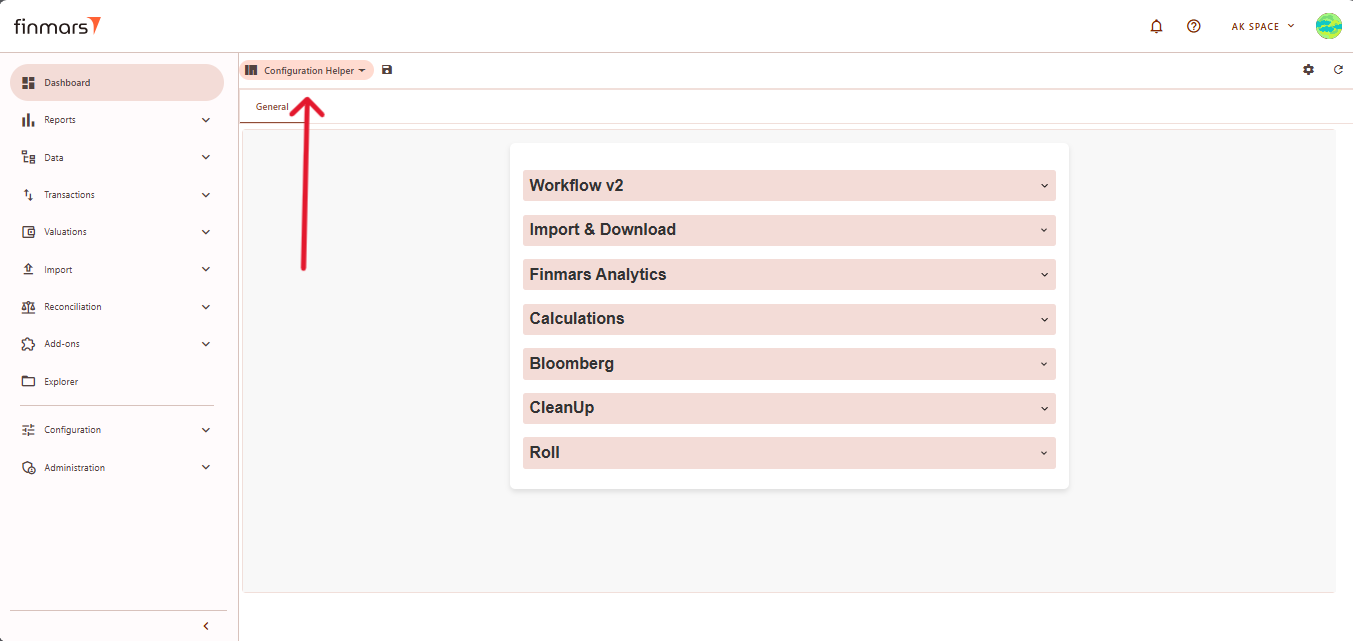
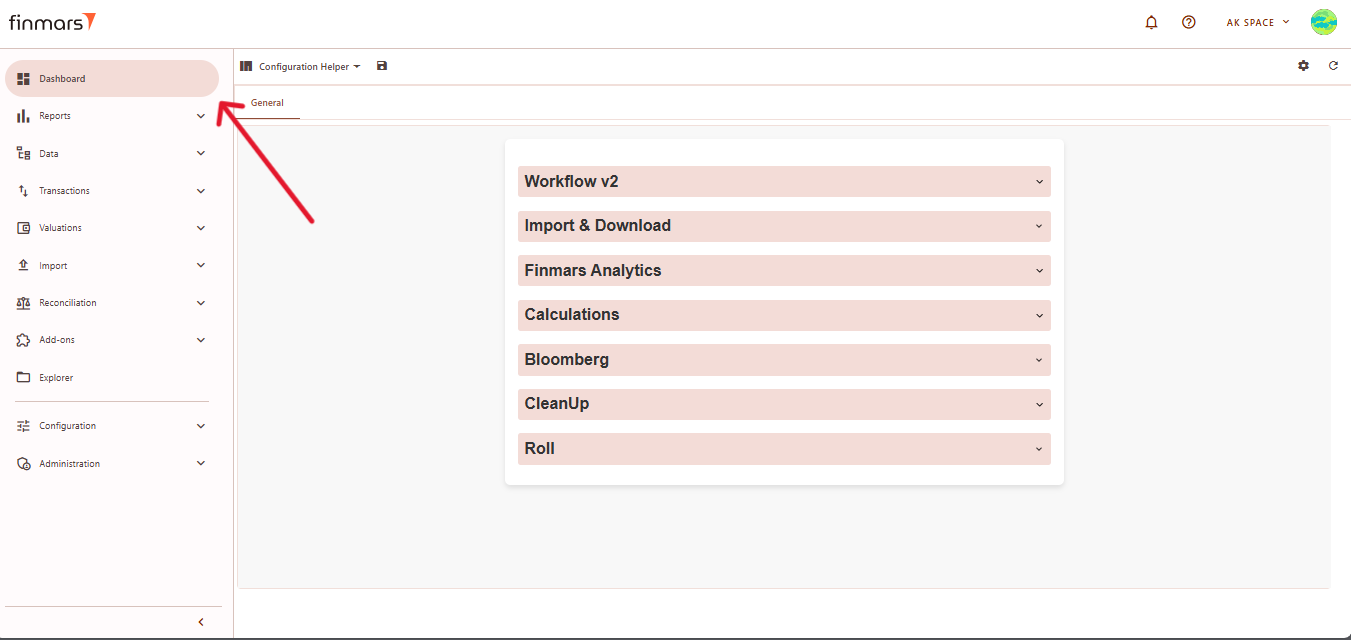
- Go to the Dashboard tab in the left-side menu.
- At the top of the page (next to the save icon), you will see the current dashboard layout name. Click on this name to open the dropdown menu listing all available layouts.

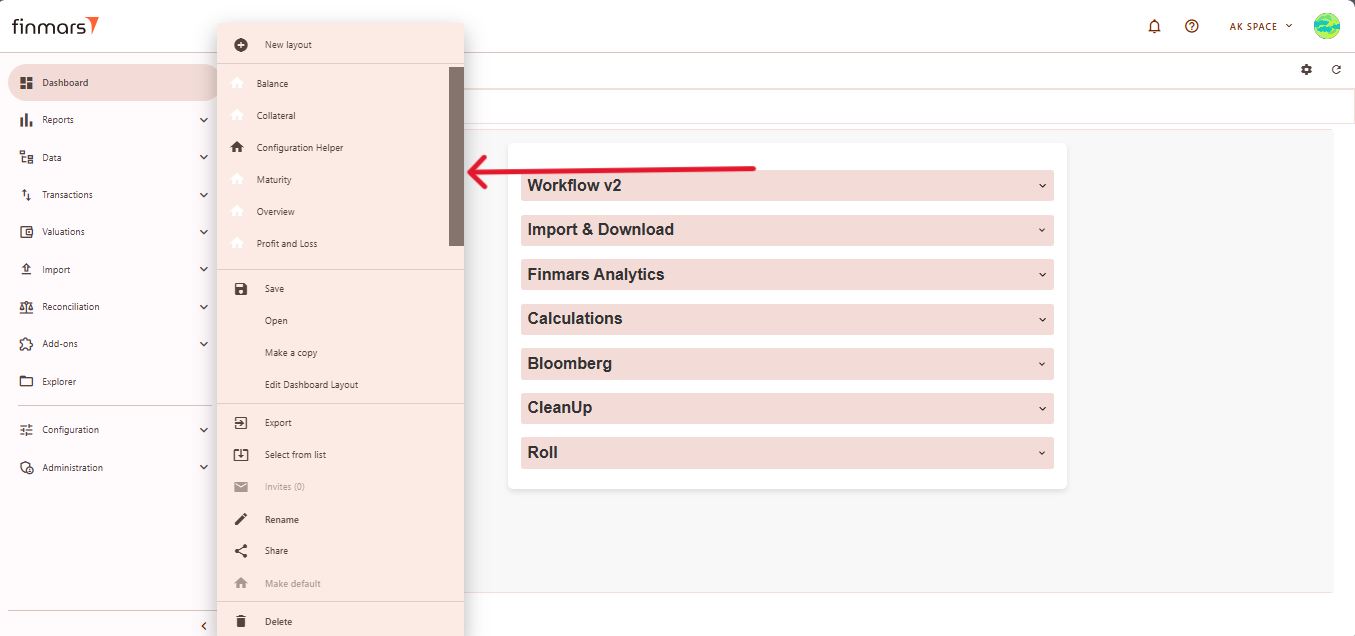
- From this dropdown, select the standard dashboard you want to check here is an overview of Standard Dashboard Layouts:
- Overview – Displays a high-level summary of key financial metrics like NAV, P&L, cash flows, and balance trends.
- Balance – Provides a detailed breakdown of portfolio assets categorized by asset type and geography.
- Collateral – Shows collateral positions, including instrument type, market value, and collateral MV.
- Configuration Helper – Contains system tools for workflow management, calculations, imports, and analytics.
- Maturity – Displays financial instruments sorted by their maturity dates and associated market values.
- Profit and Loss – Presents P&L data per portfolio, displaying profit trends over time.

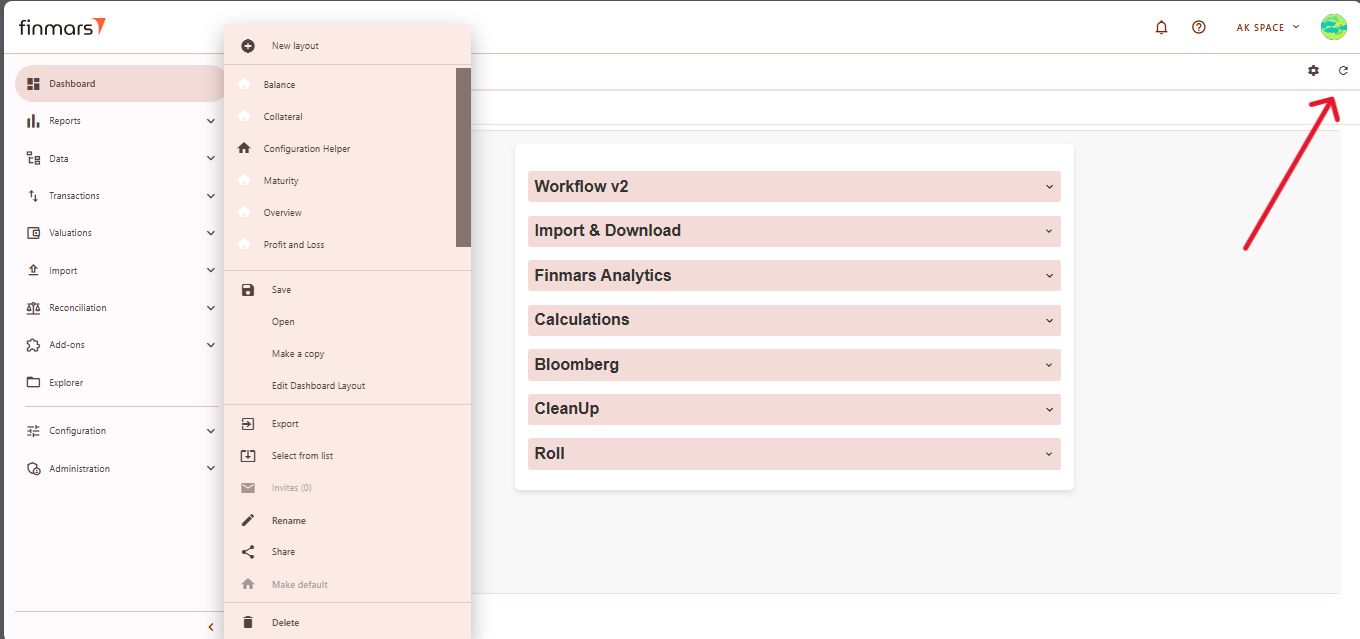
- After selecting the layout, verify once again that the information displayed is correct and accurately reflects the current data status. If any discrepancies occur, refresh the data and layout by clicking the Refresh button in the top-right corner to ensure you're viewing the latest information.