Add Pie Chart to Your PDF Report
In this article you will learn how to add various charts to your PDF Report. Lets start!
So, you have your canvas, lets drop new block there Python Plot Chart
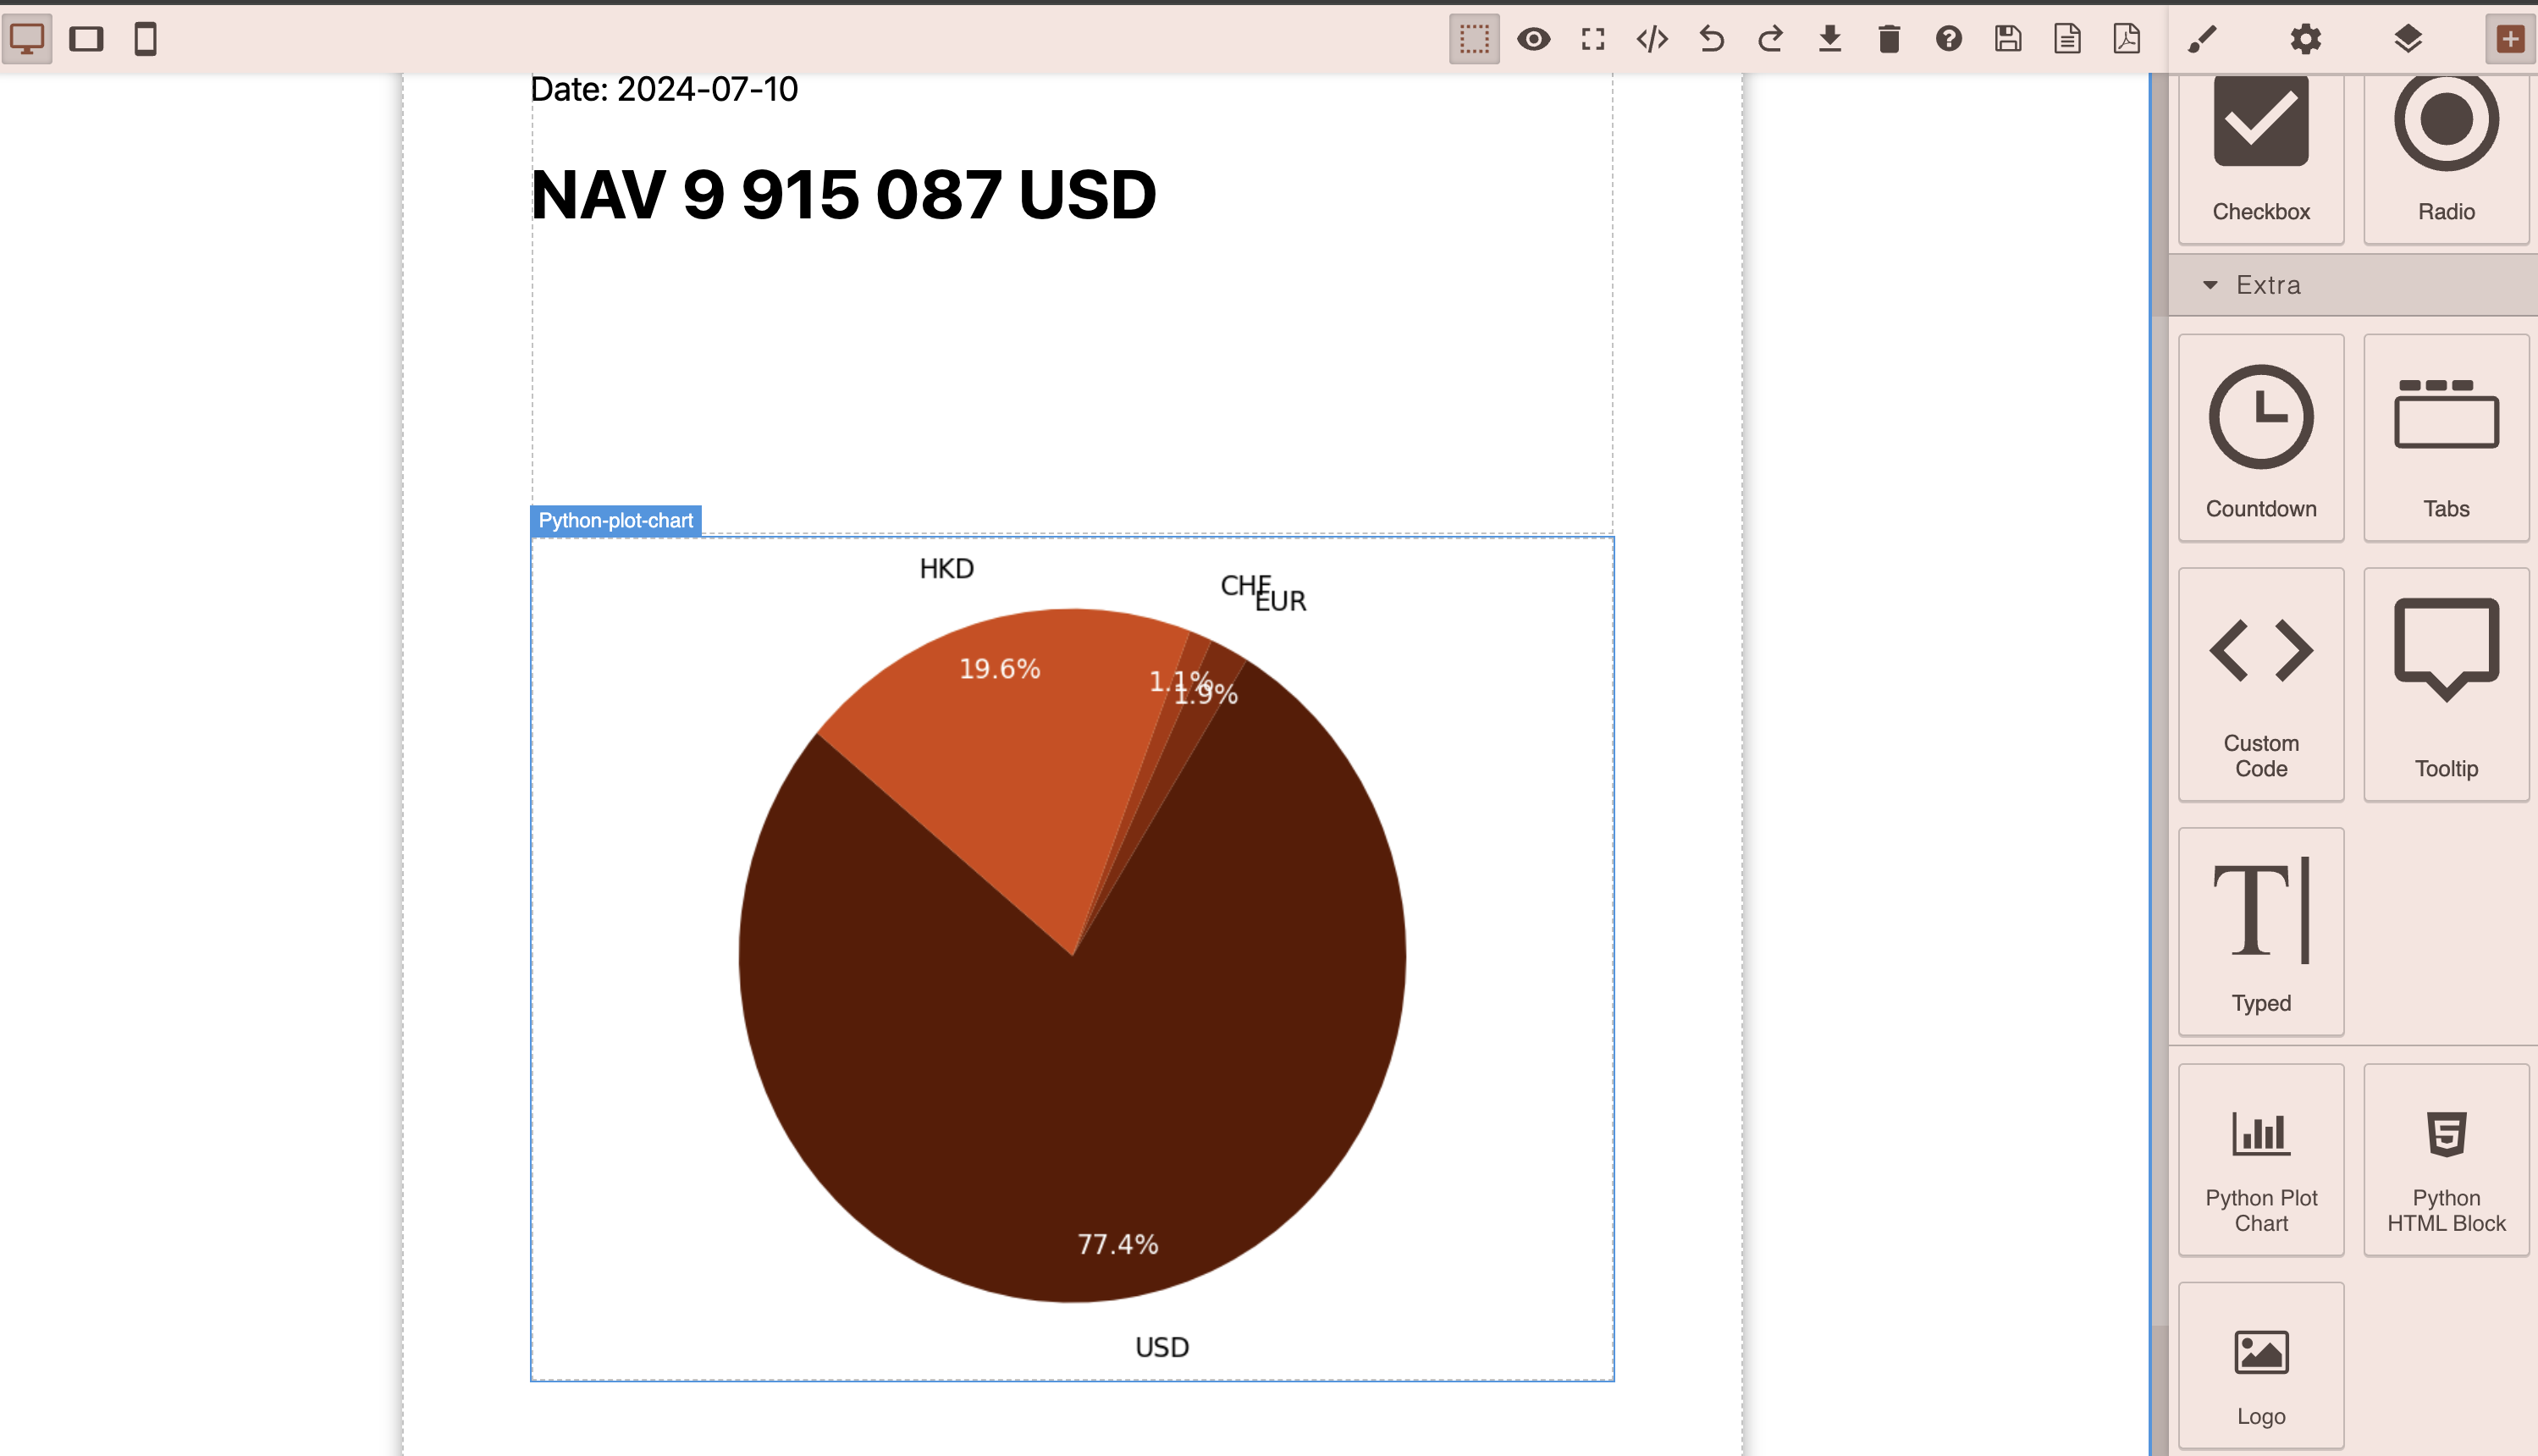
Logic absolutely the same as with Python HTML Block, the only difference that we expect from Python Plot Chart an Image as output
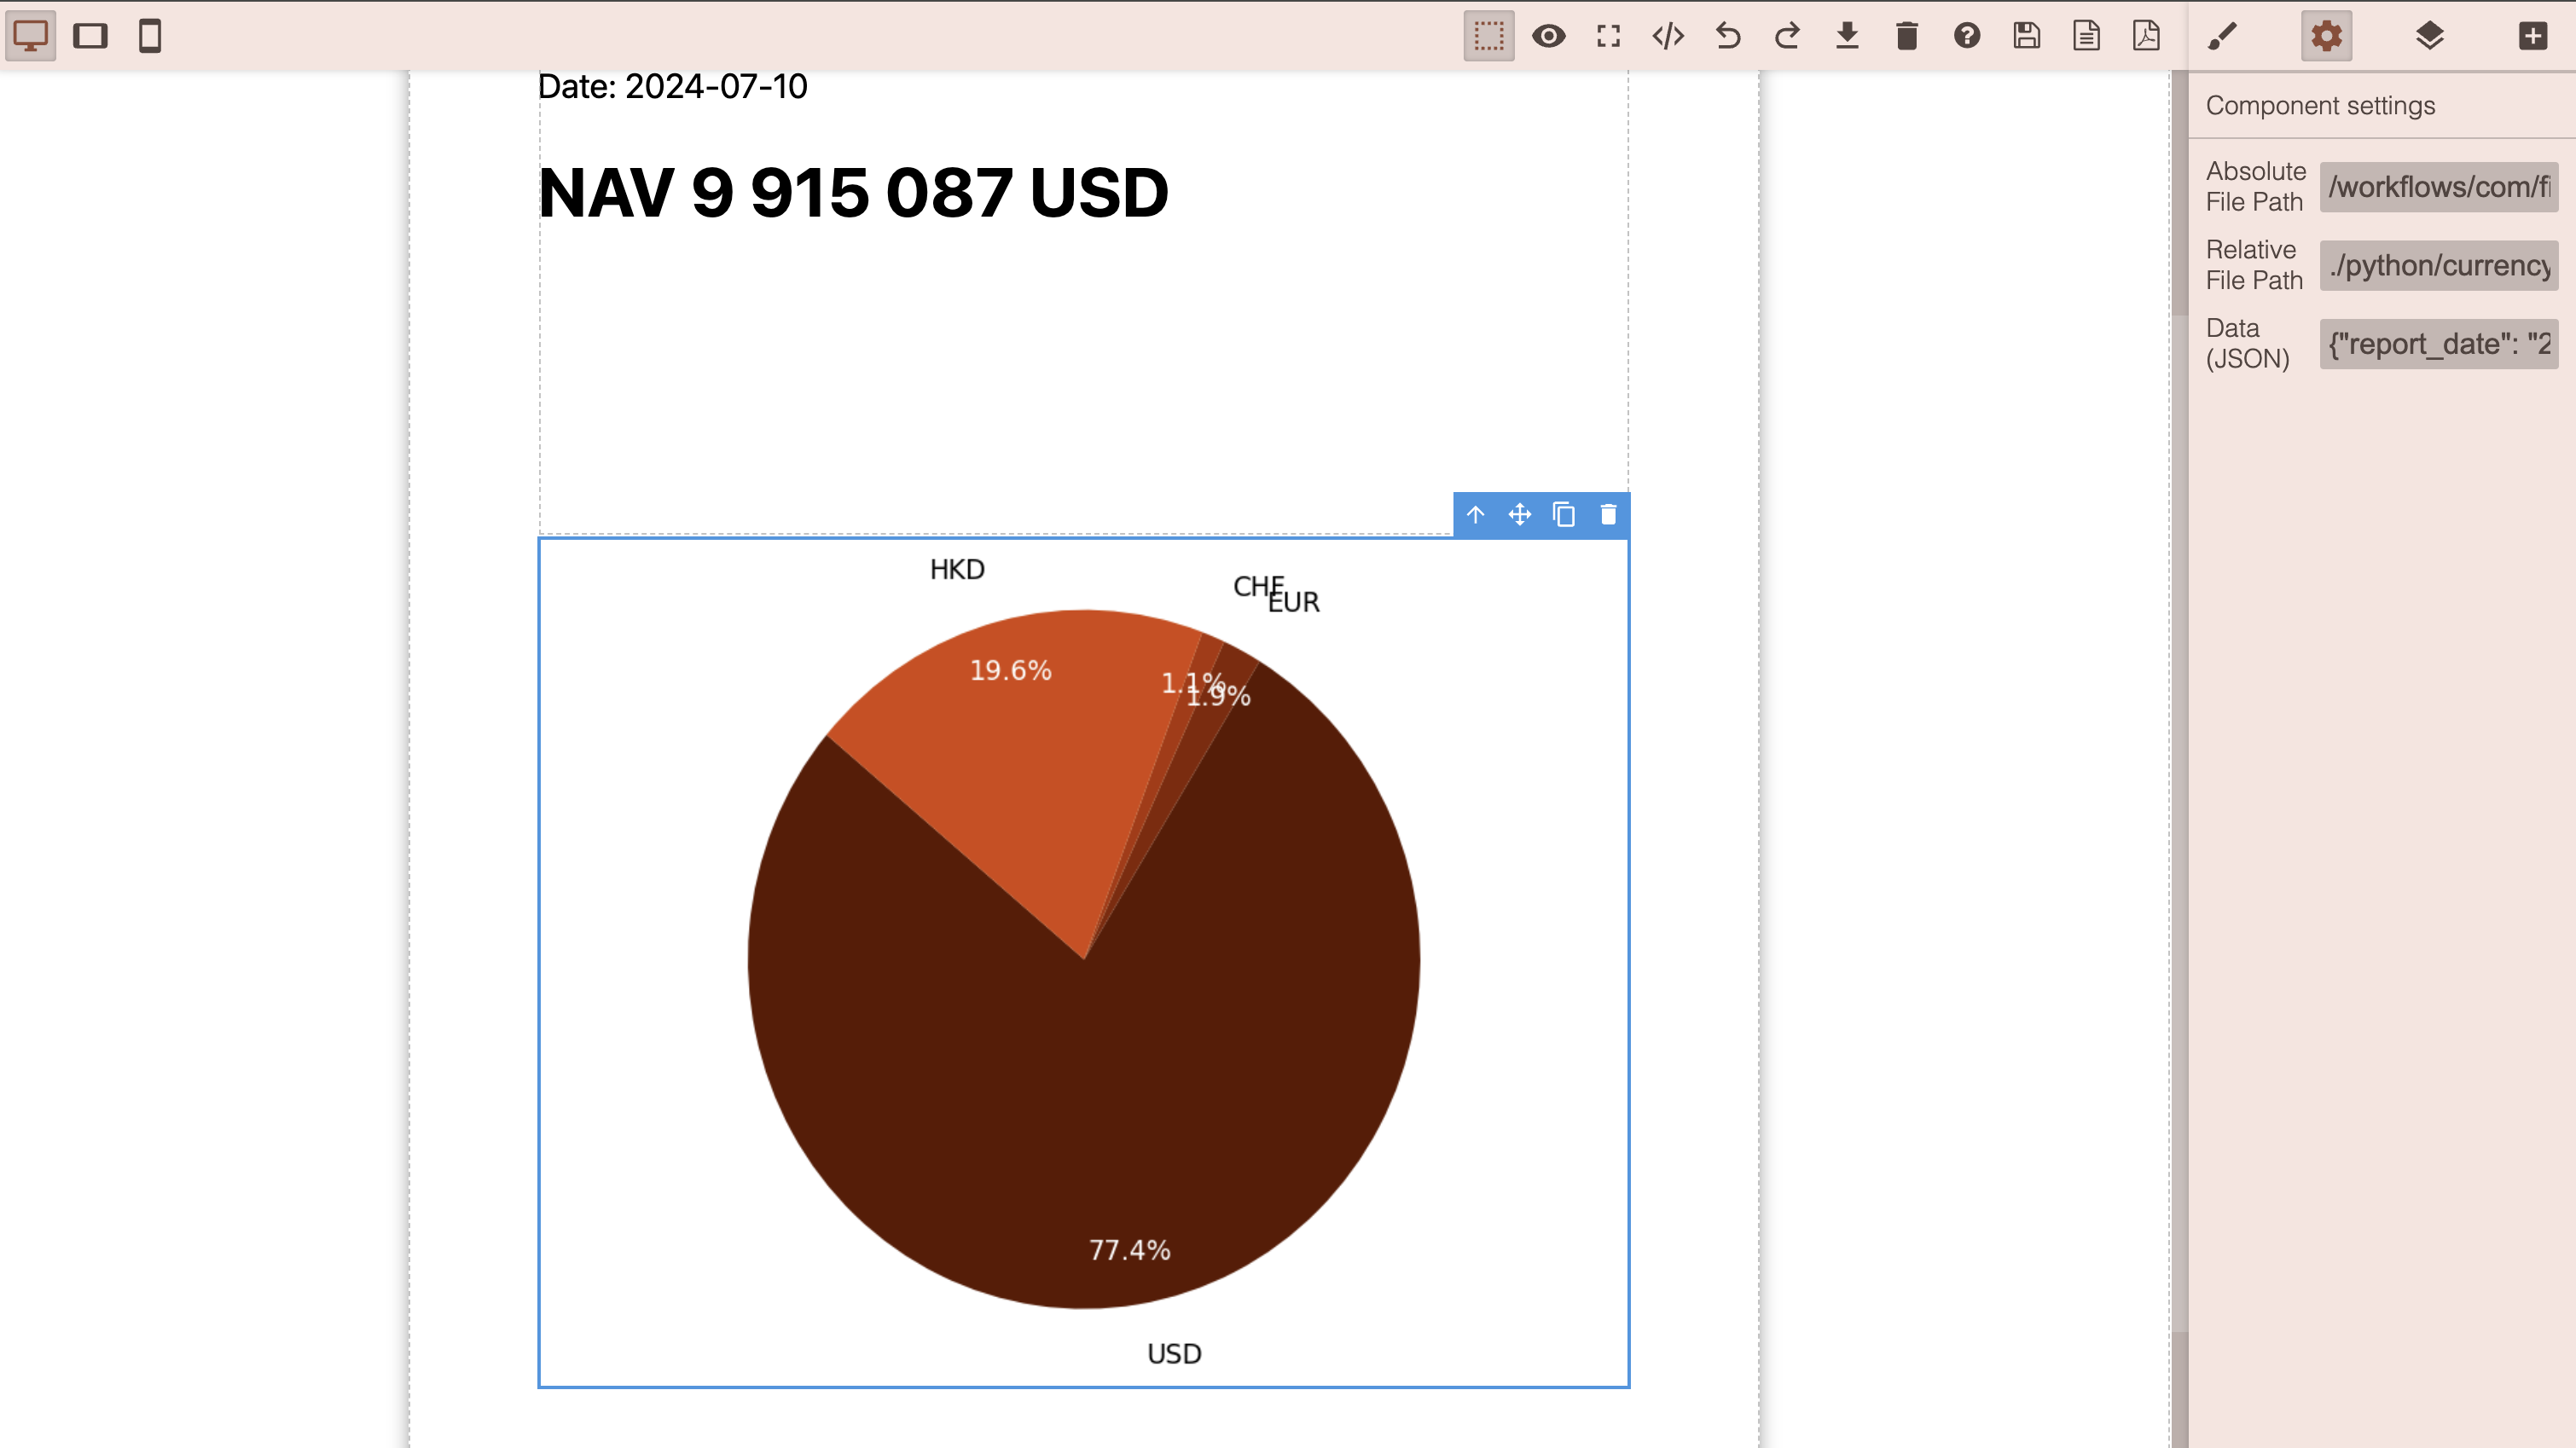
In settings Panel same options and same rules as for Python HTML Block
Lets see what is inside of code