Add Chart to you PDF Report
Okay, we discover how to add static content, what about dynamic content? Lets find out
As I previously mention you have python/* folder with your .ipynb scripts, lets create a simple python script python/example.ipynb
And lets output some content
nav = 1000000

report_currency = 'USD'

result = f"<h1>NAV: {nav} {report_currency}</h1>"

print(result)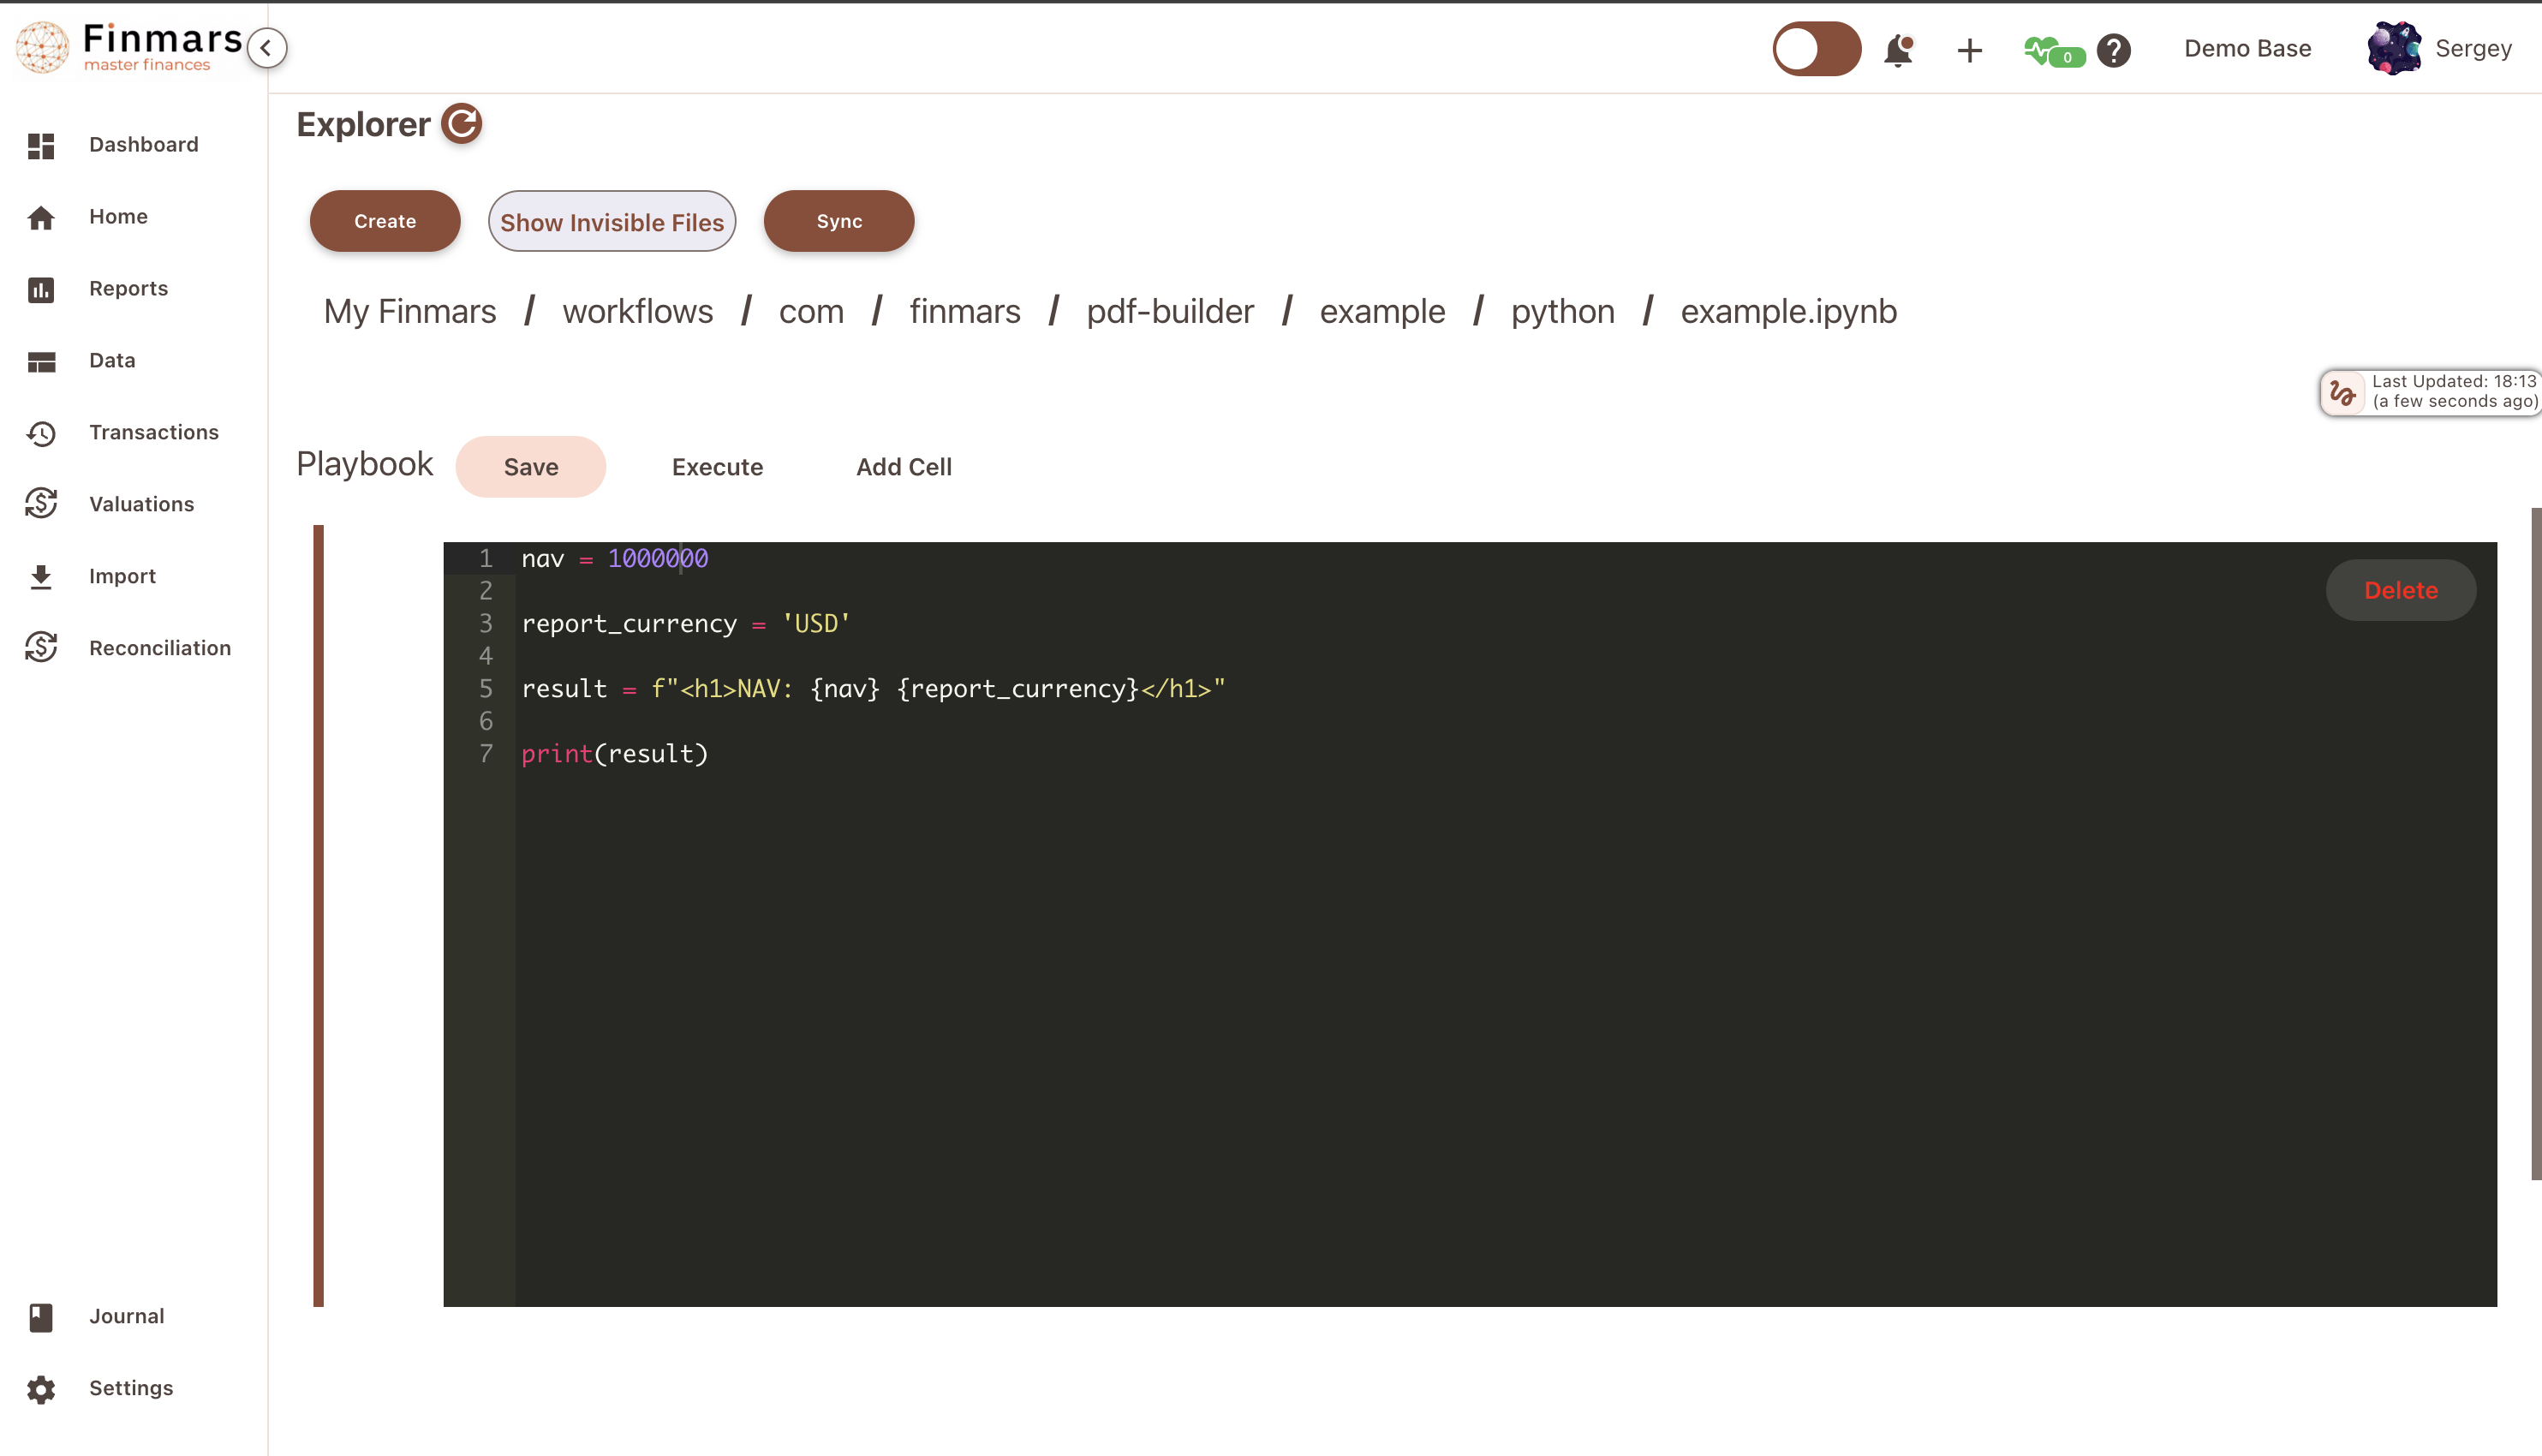
Well done, lets go back to our PDF Builder
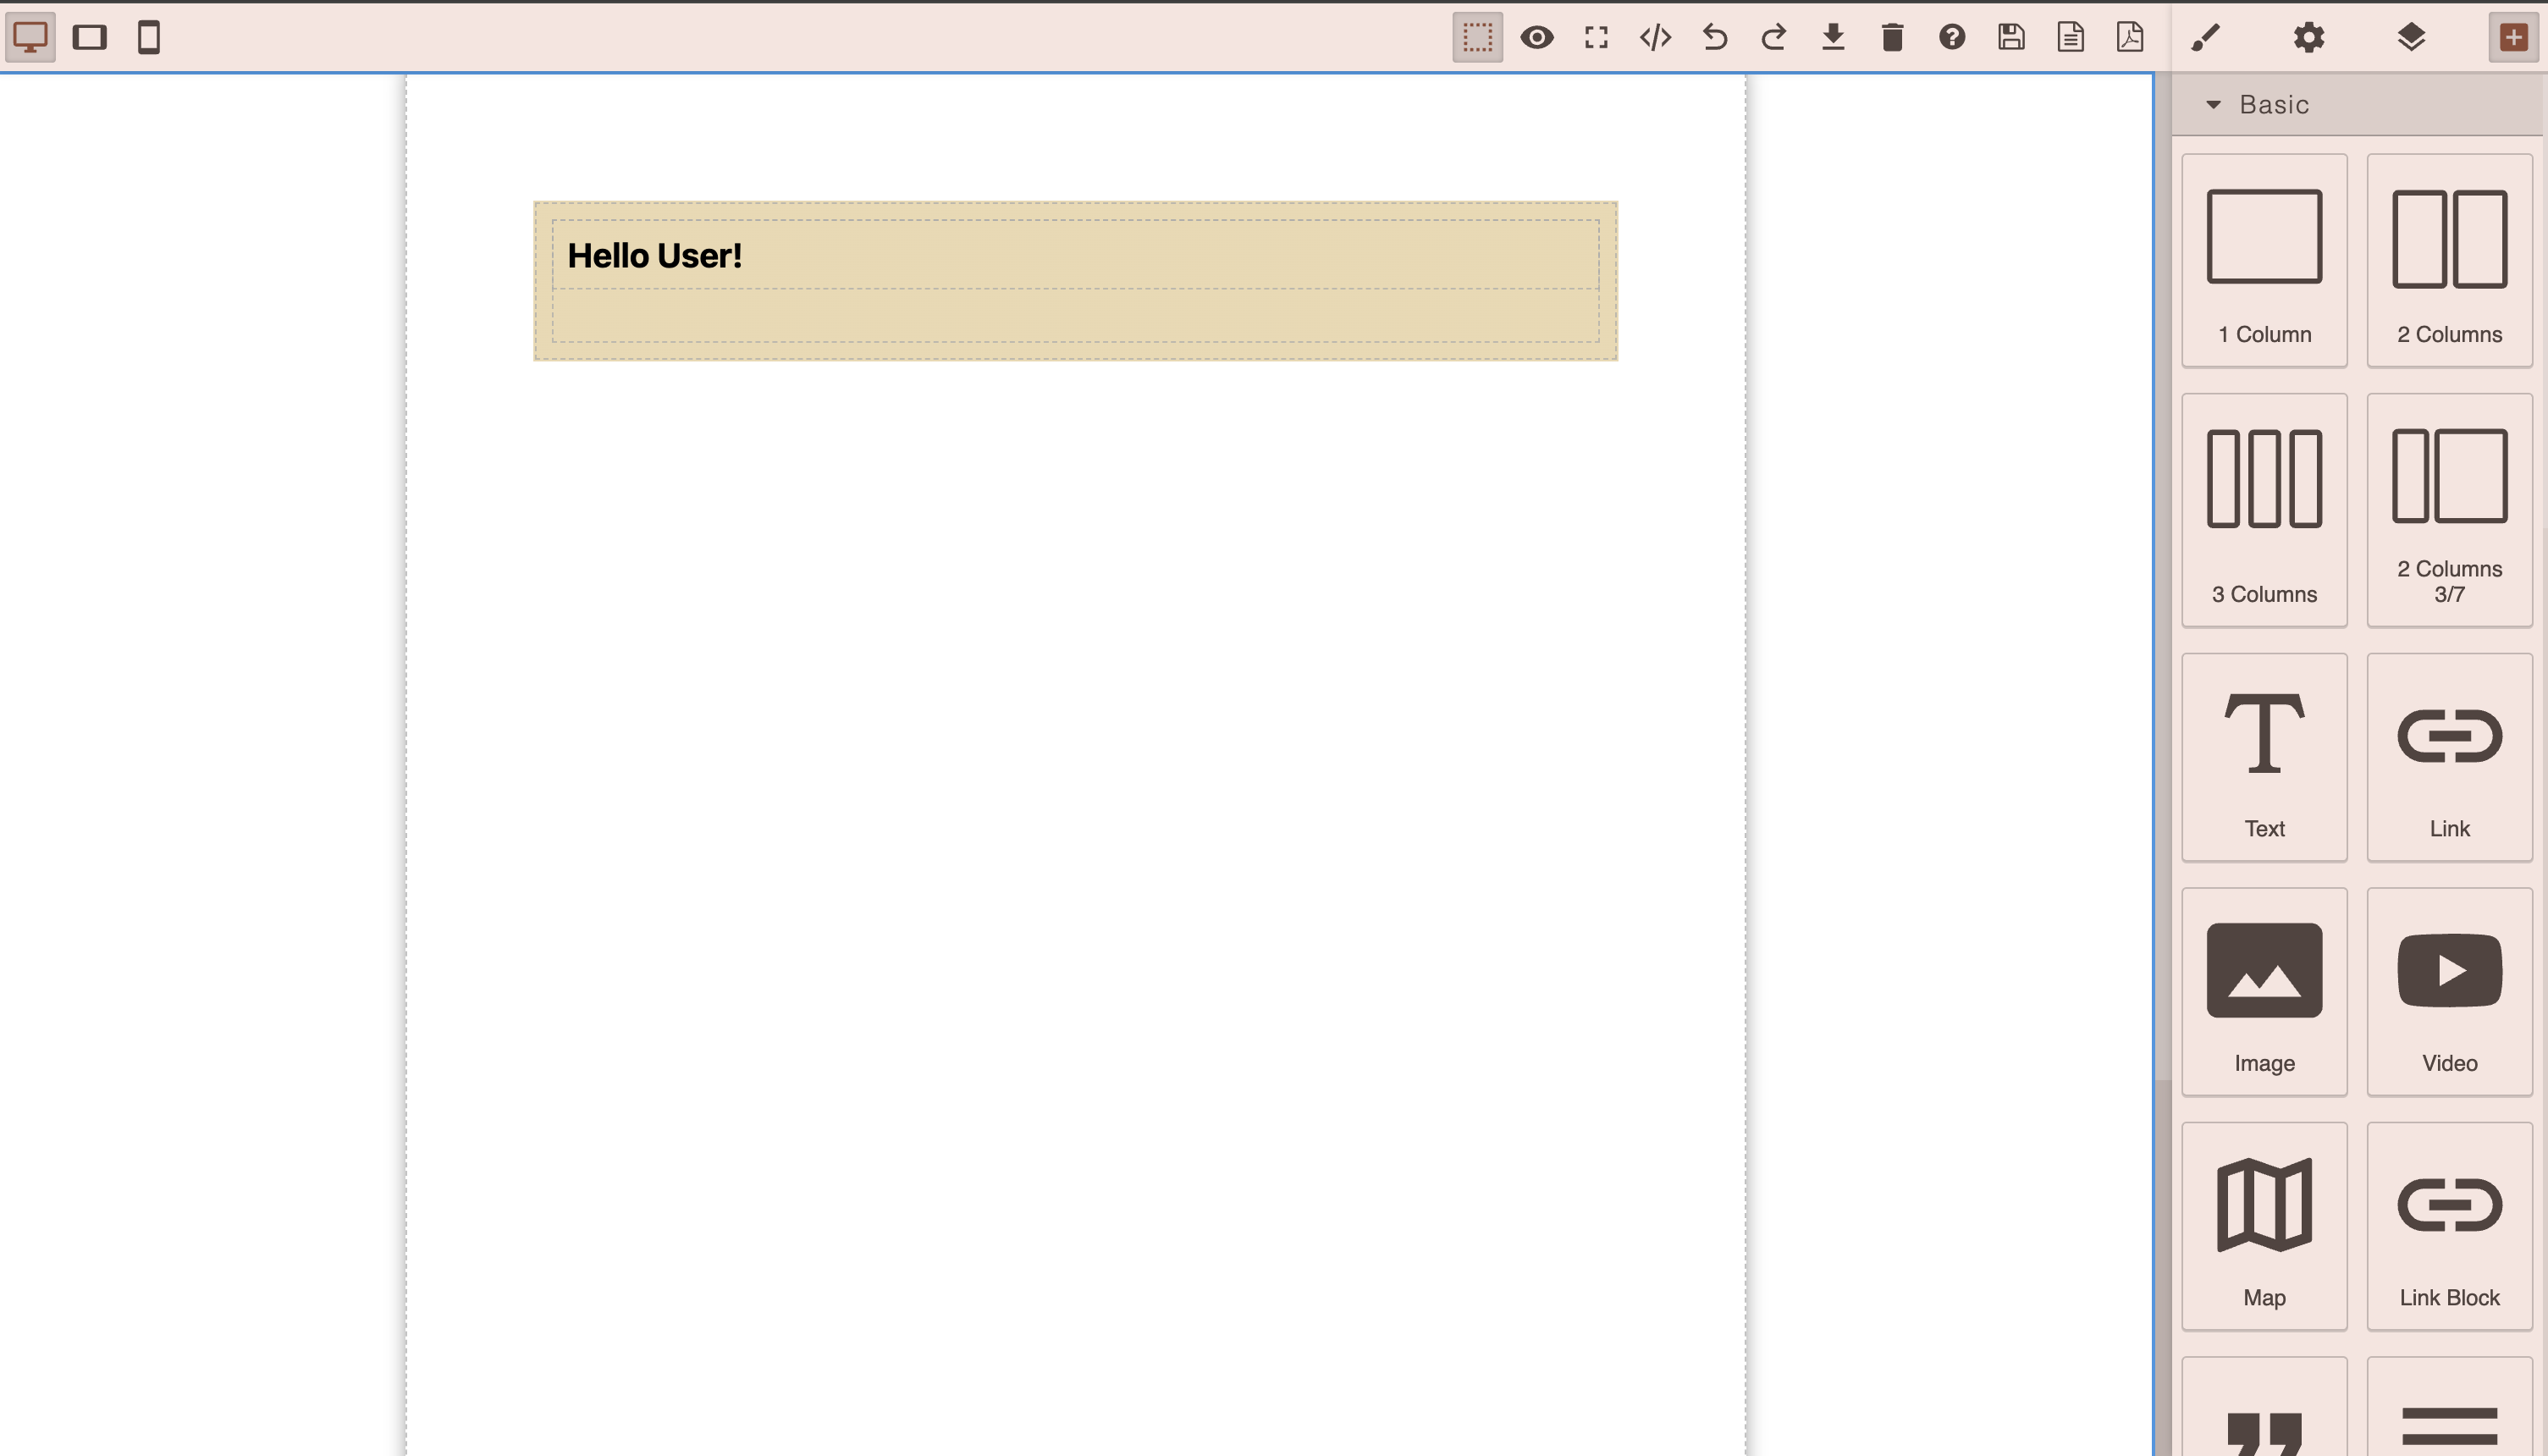
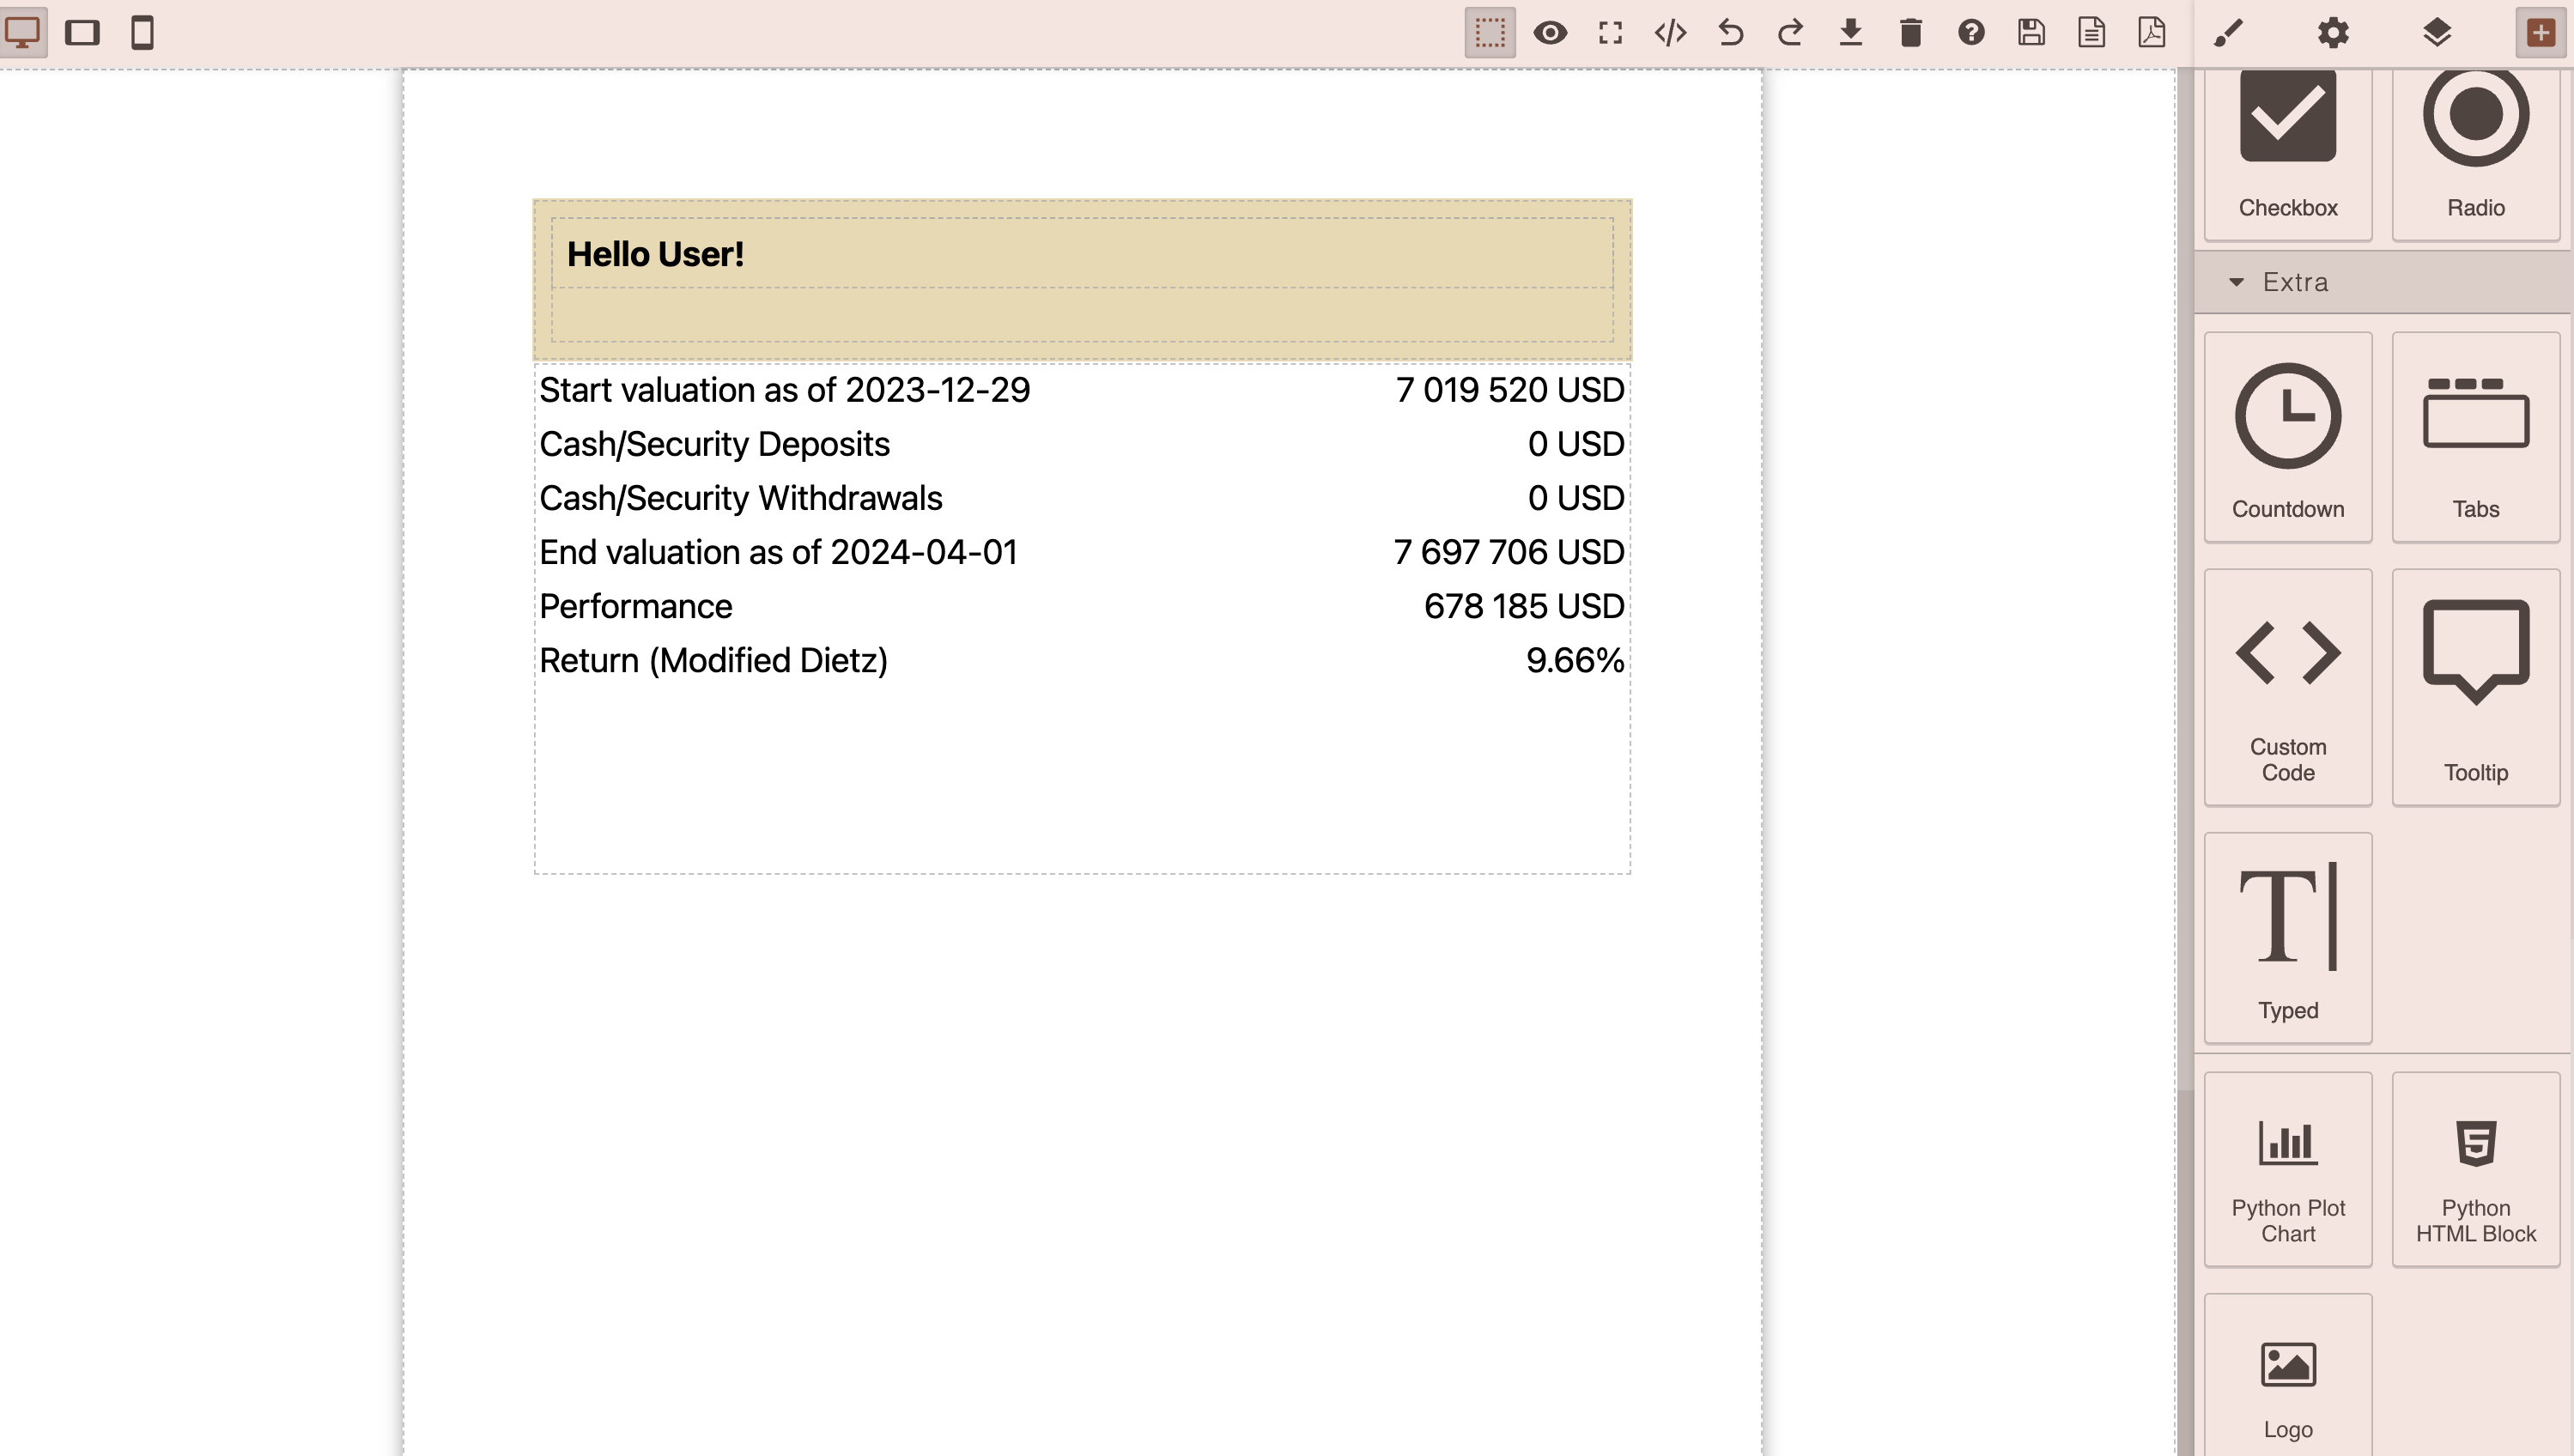
Scroll down and find Block - Python HTML Block, drop it on canvas
Then click on it, and let see the Block Settings (On right sidebar, cog button)
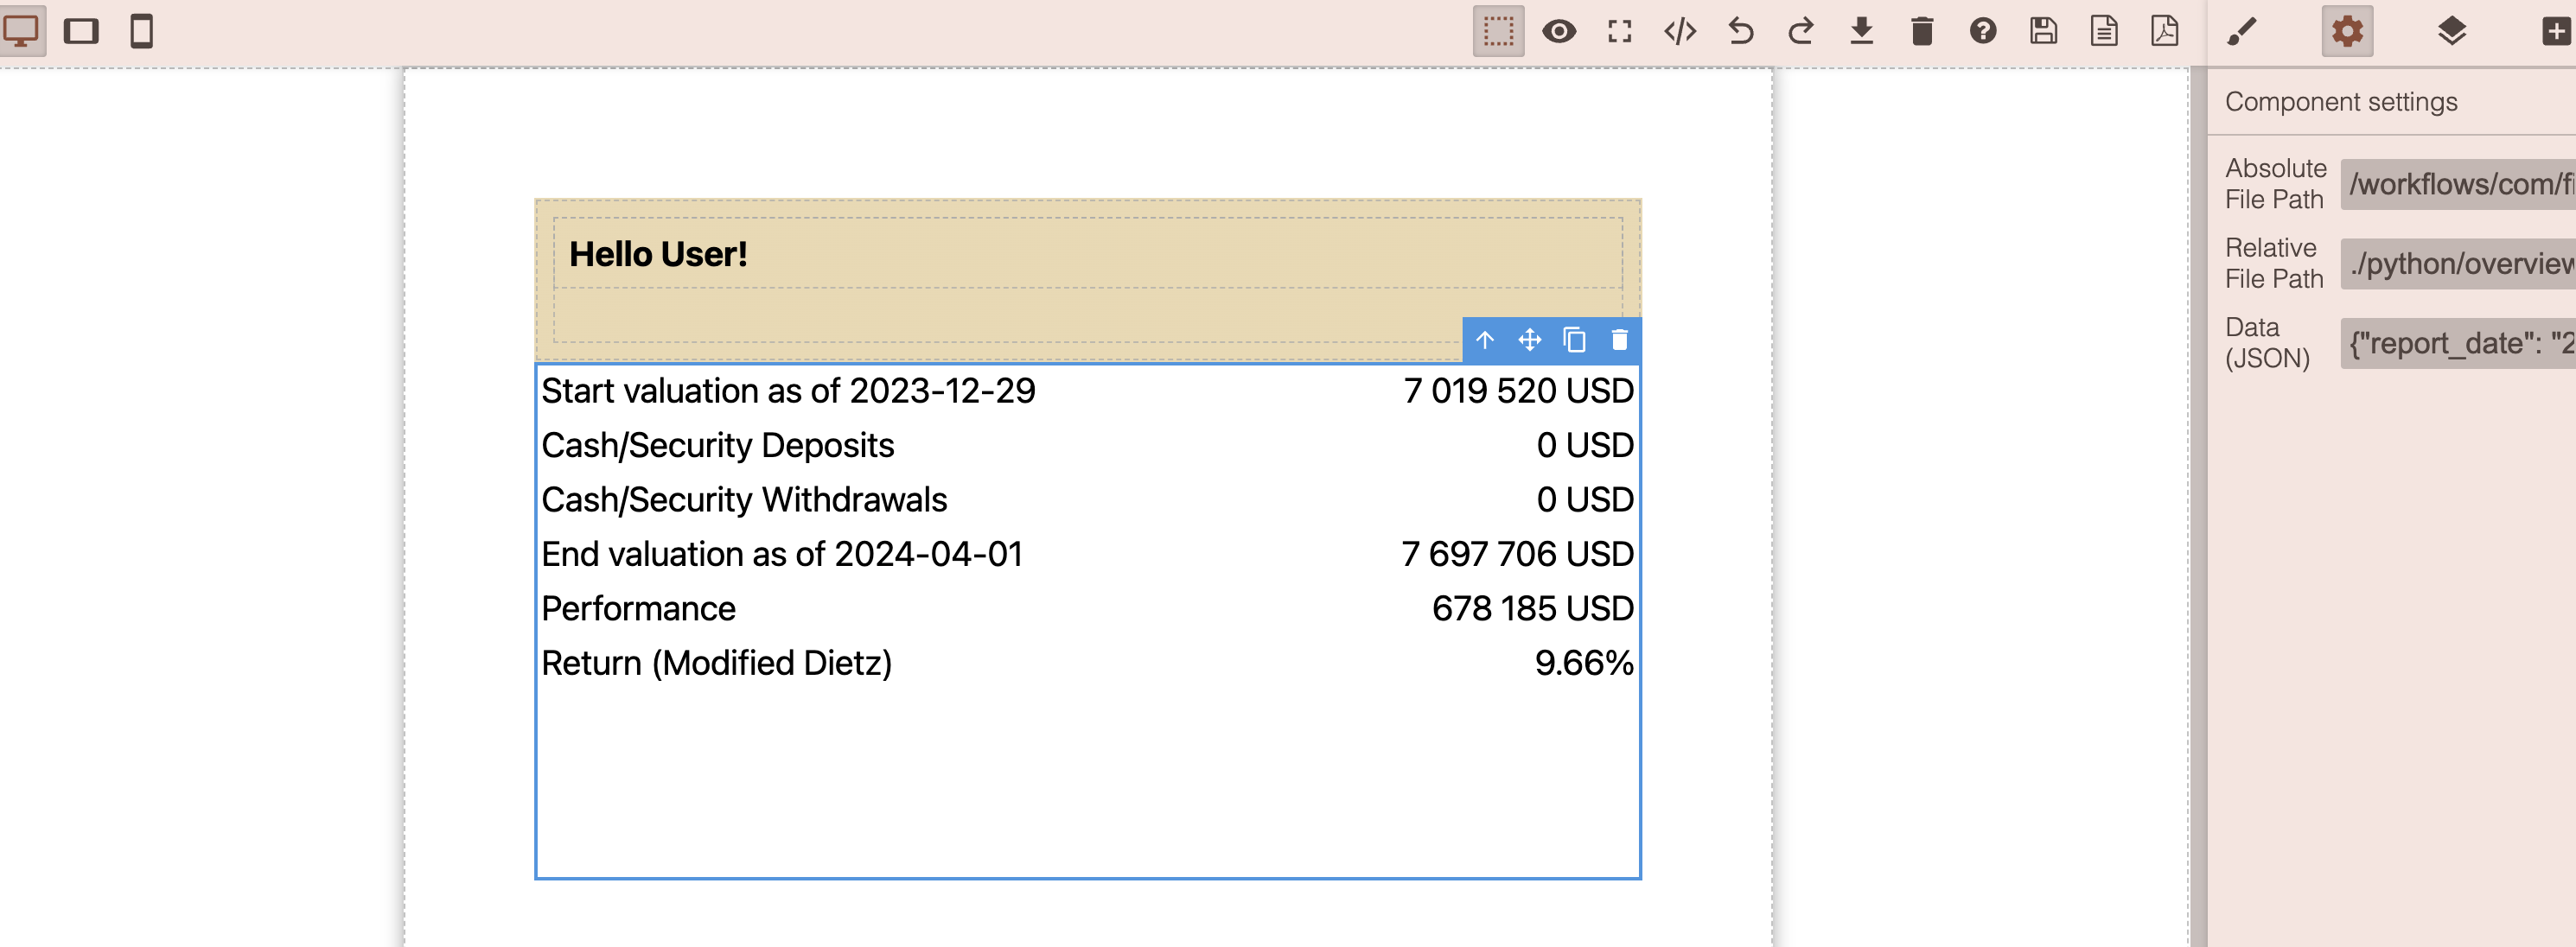
So we have here 3 inputs
Absolute File Path - full path from root (/) of your Space Storage
Relative File Path - path from your builder location, so you can do like .python/example.ipynb
Data (JSON) - json field that could have some predefined settings for you .ipynb script
NOTA BENE: Relative File Path when set, it overrides Absolute File Path, so if you dont need relative path, just set it to null and use absolute path, otherwise, dont use Absolute File Path, when you type Relative File Path it will automatically calculated and passed to Absolute File Path
Lets put ./python/example.ipynb and see what will happen
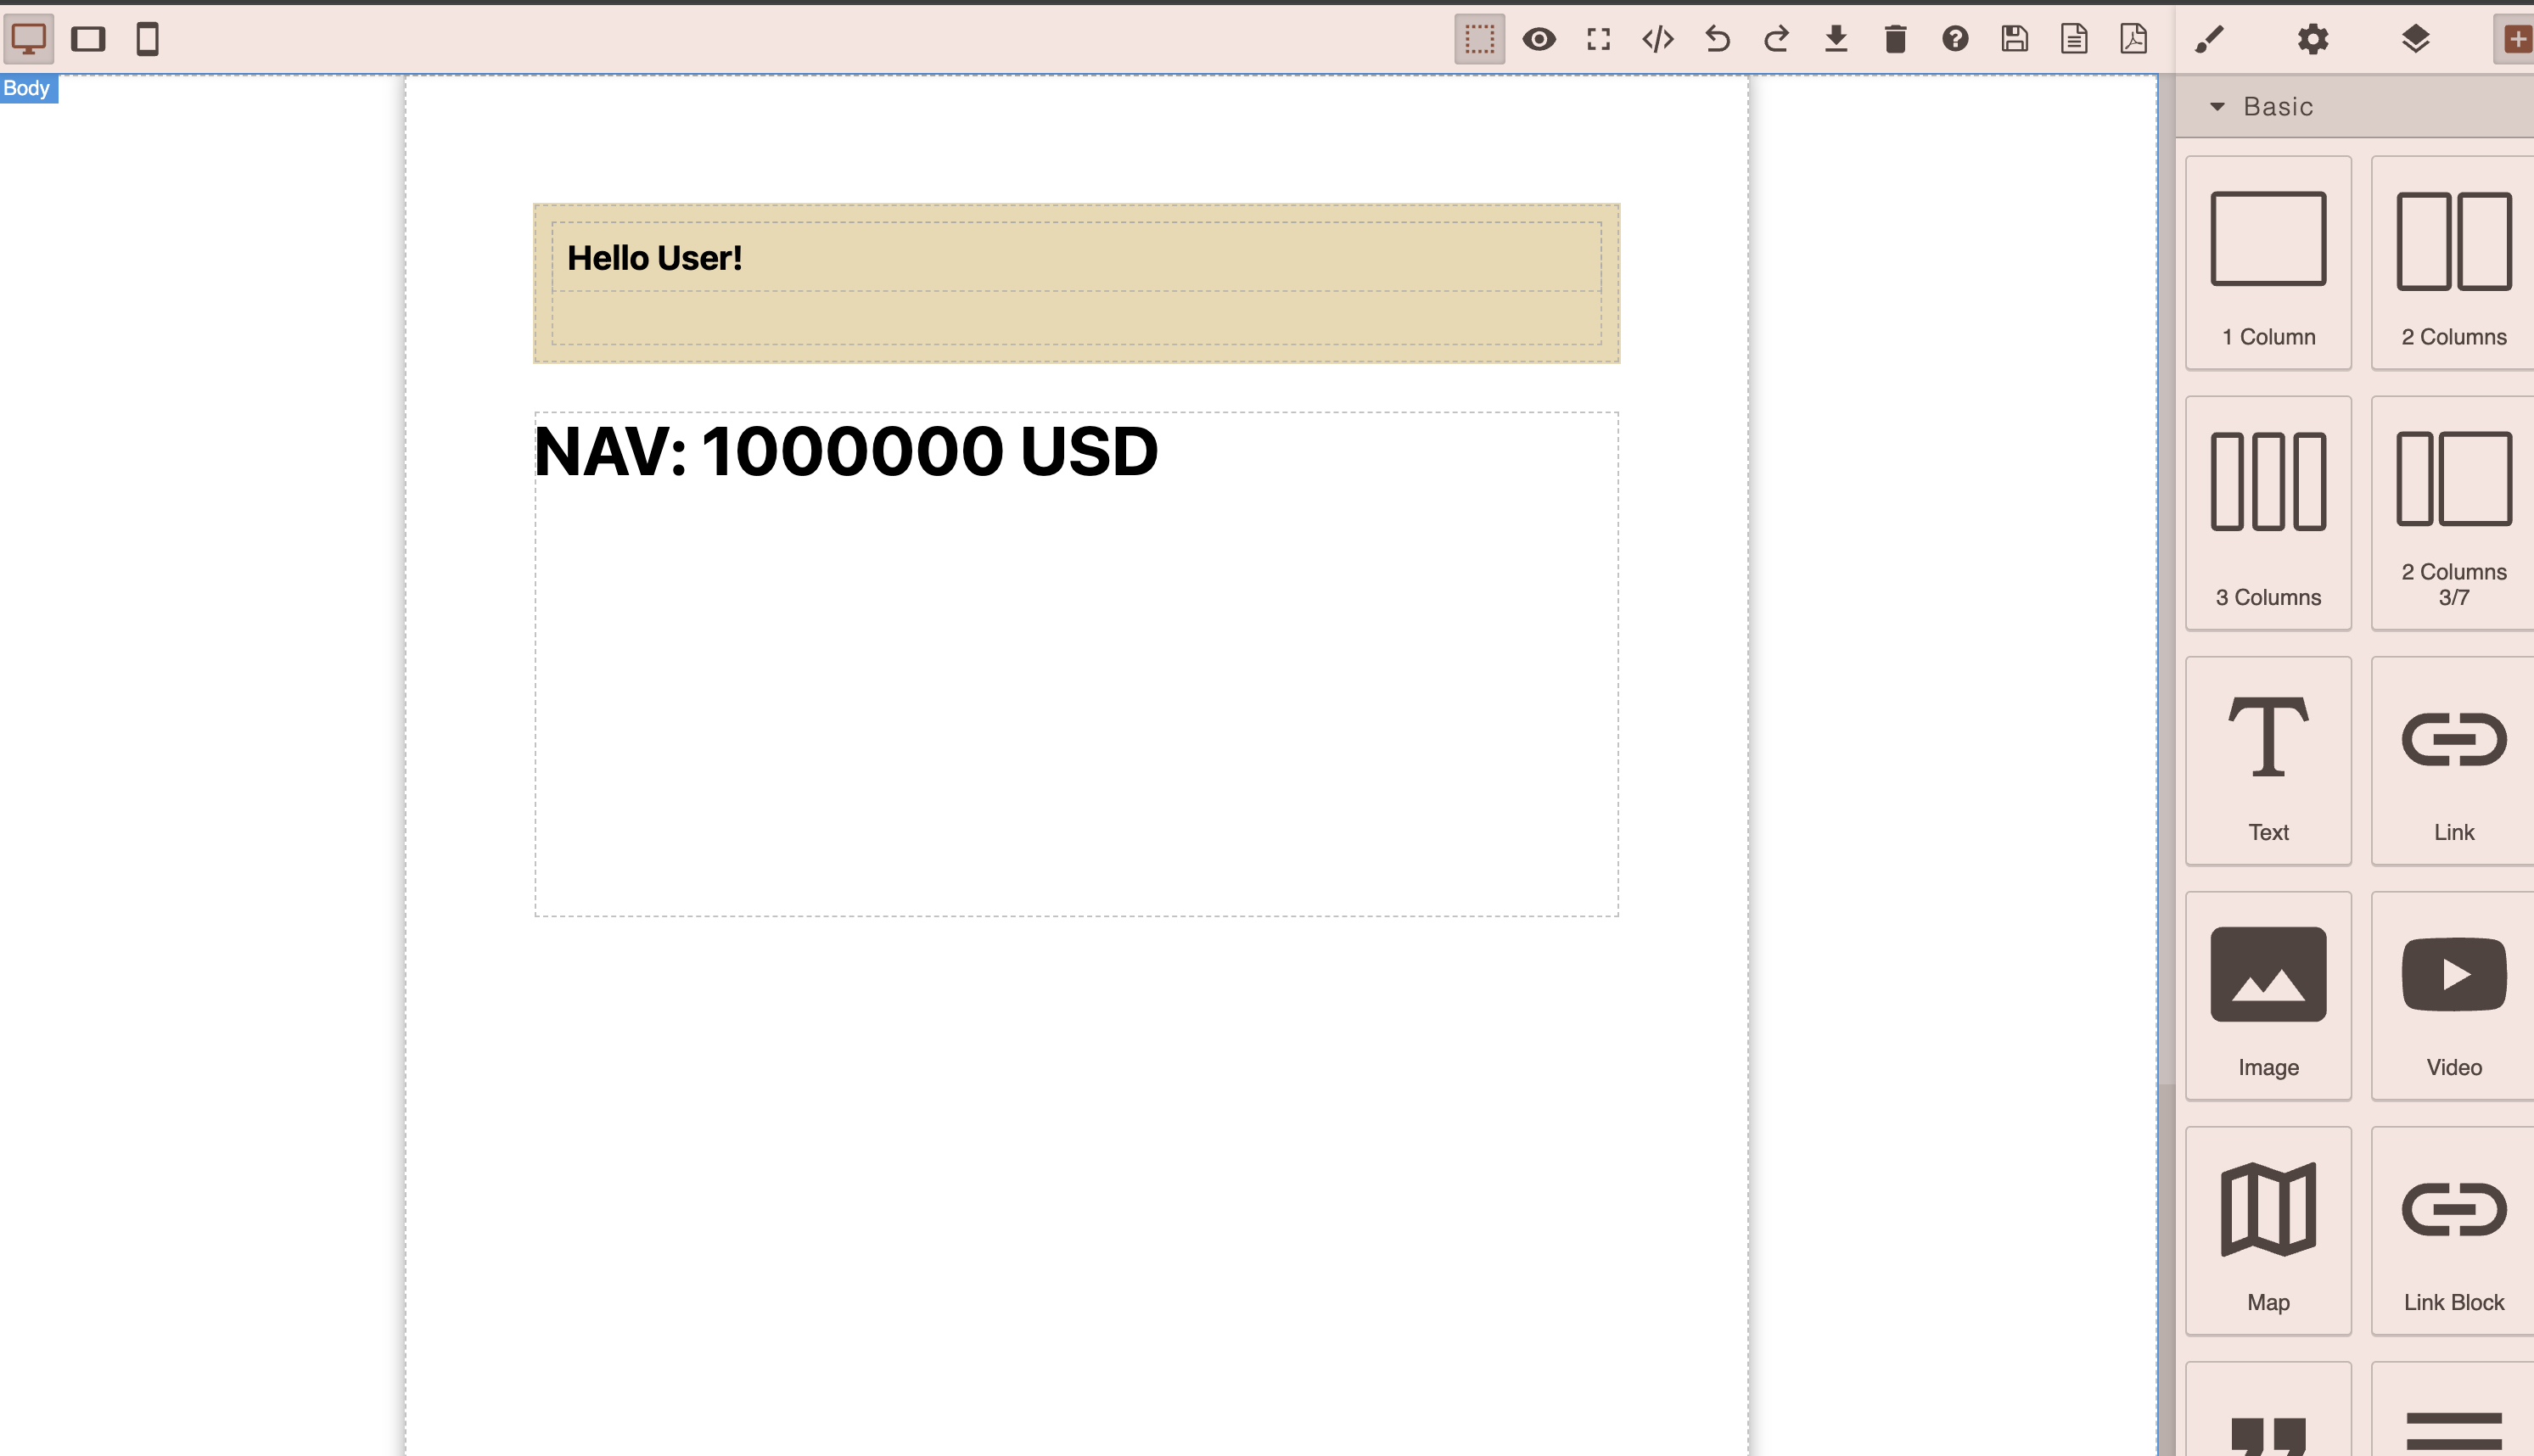
Great, now the result of your python/example.ipynb is executed and added to your PDF Template, well Done