# PDF Builder
Powerful tool that helps create custom PDF Reports of all sorts
# Getting Started
To install module
Go to Settings -> Marketplace
Type PDF Builder in search input
[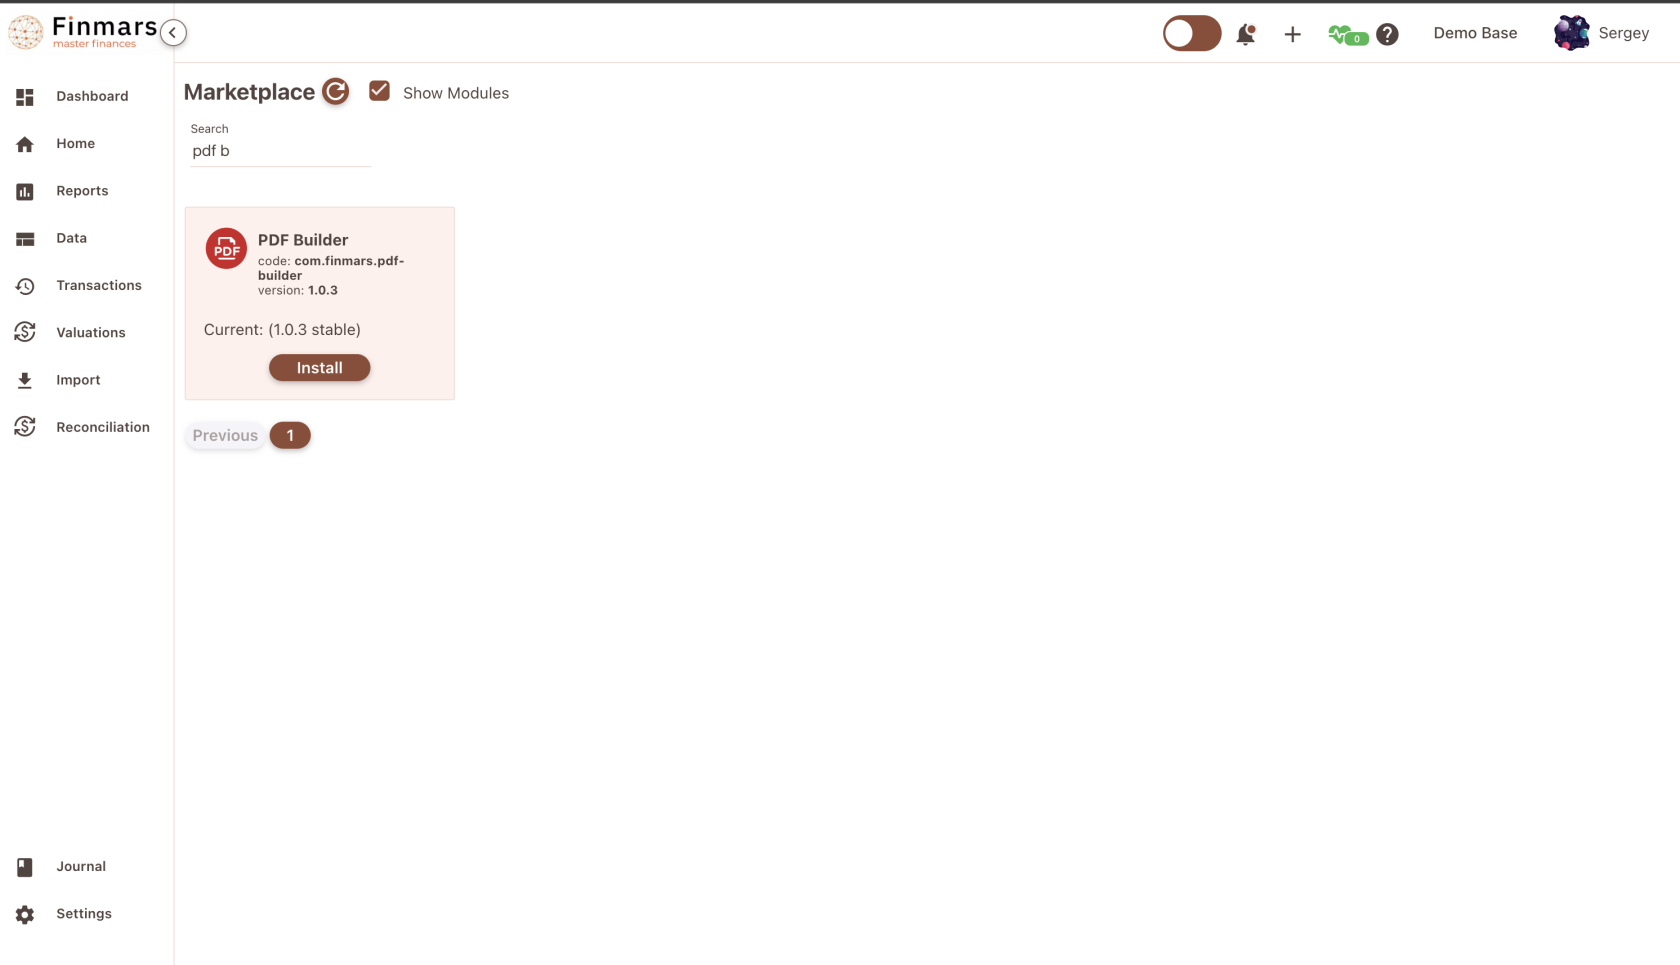](https://docs.finmars.com/uploads/images/gallery/2024-08/screenshot-2024-08-15-at-17-12-36.png)
Then press Install
Wait until installation is finished
Then go to Explorer -> workflows -> com -> finmars -> pdf-builder
[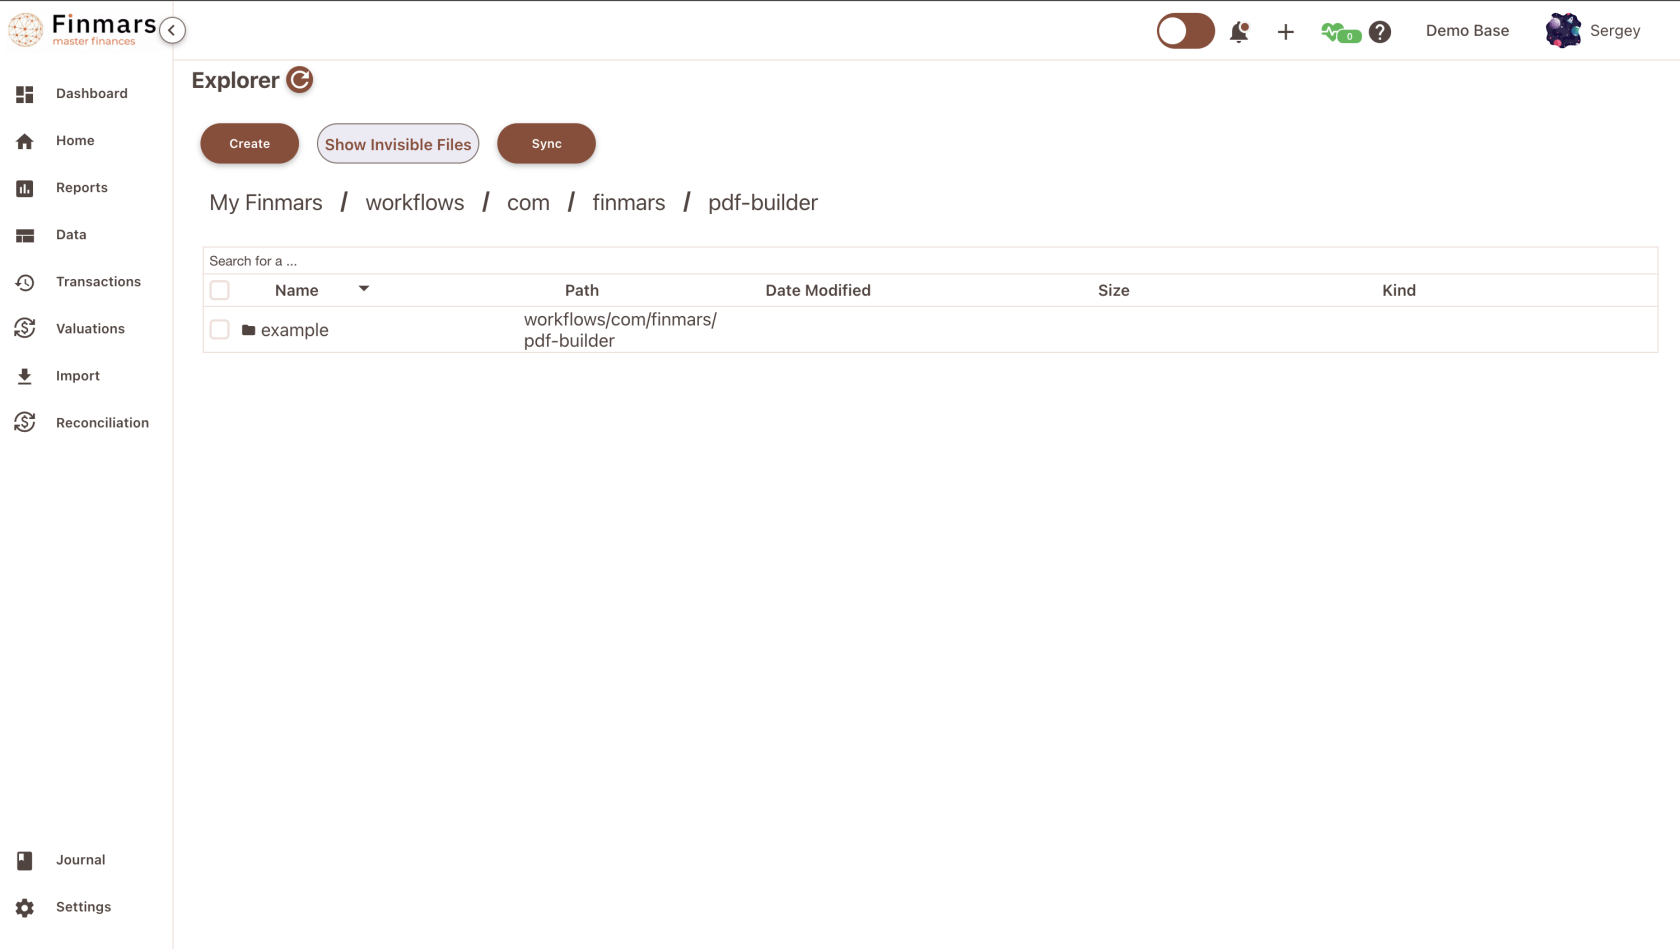](https://docs.finmars.com/uploads/images/gallery/2024-08/screenshot-2024-08-15-at-17-13-41.png)
Here you could see an Example folder, which contains all necessary files to prepare PDF Report
Basic Structure of module:
[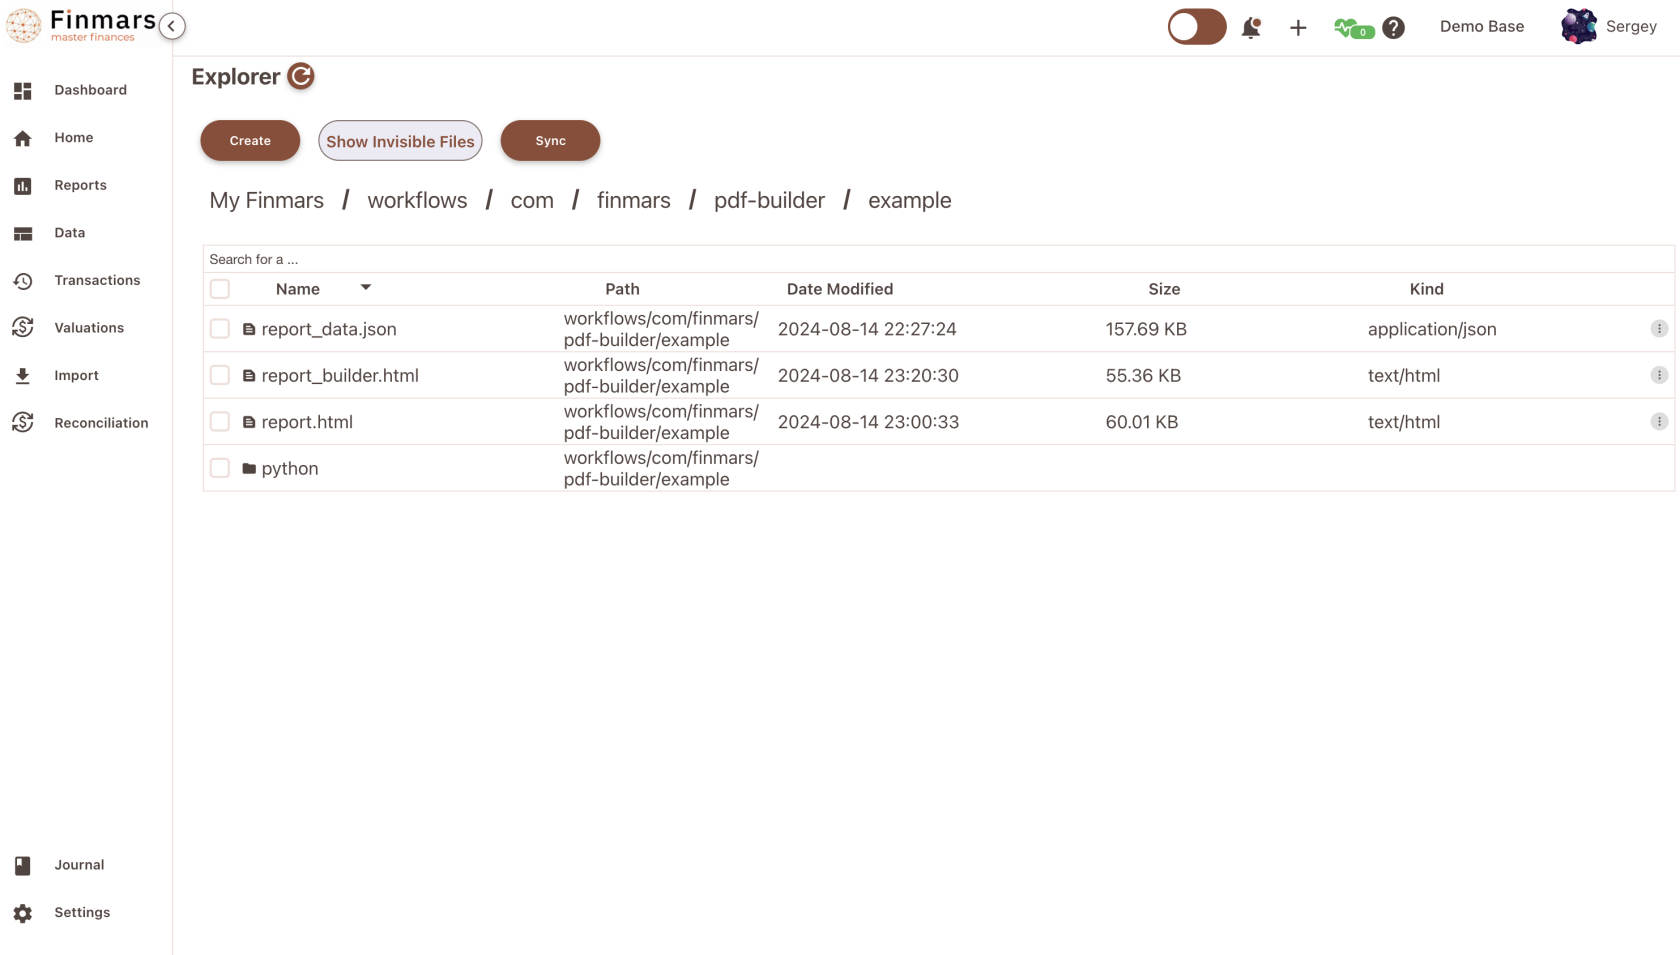](https://docs.finmars.com/uploads/images/gallery/2024-08/screenshot-2024-08-15-at-17-14-55.png)
So to create own PDF report is best to create own folder (as the way "example" folder ) and copy all files from it
So, pattern is following
**%page\_name%\_builder.html** - Actual PDF Engine when user can create own PDF Report using WYSWYG editor with Drag & Drop Functionality
**%page\_name%\_data.json** - its a meta file, you dont need to touch it, if you start from scratch, you probably even dont needed. Its result of pressing "Save" in %page\_name%\_builder.html. It contains your State - your components, html, styles and everything that needs to PDF Builder to work.
**%page\_name%.html** - Also optional page, its just result of PDF Builder, it can be outputed not only to PDF but to HTML as well
Actually to make it all clear, here is simple schema
PDF Builder -> HTML page -> PDF Services - PDF file
So pdf builder always outputs HTML page that later will be sent to PDF Printer Service (pupeteer tool) and in return user will receive PDF page as he printed it in Web Browser
**/python** - that user content, it holds basically files of .ipynb python scripts, where **first cell** being executed and output returns to .html page
[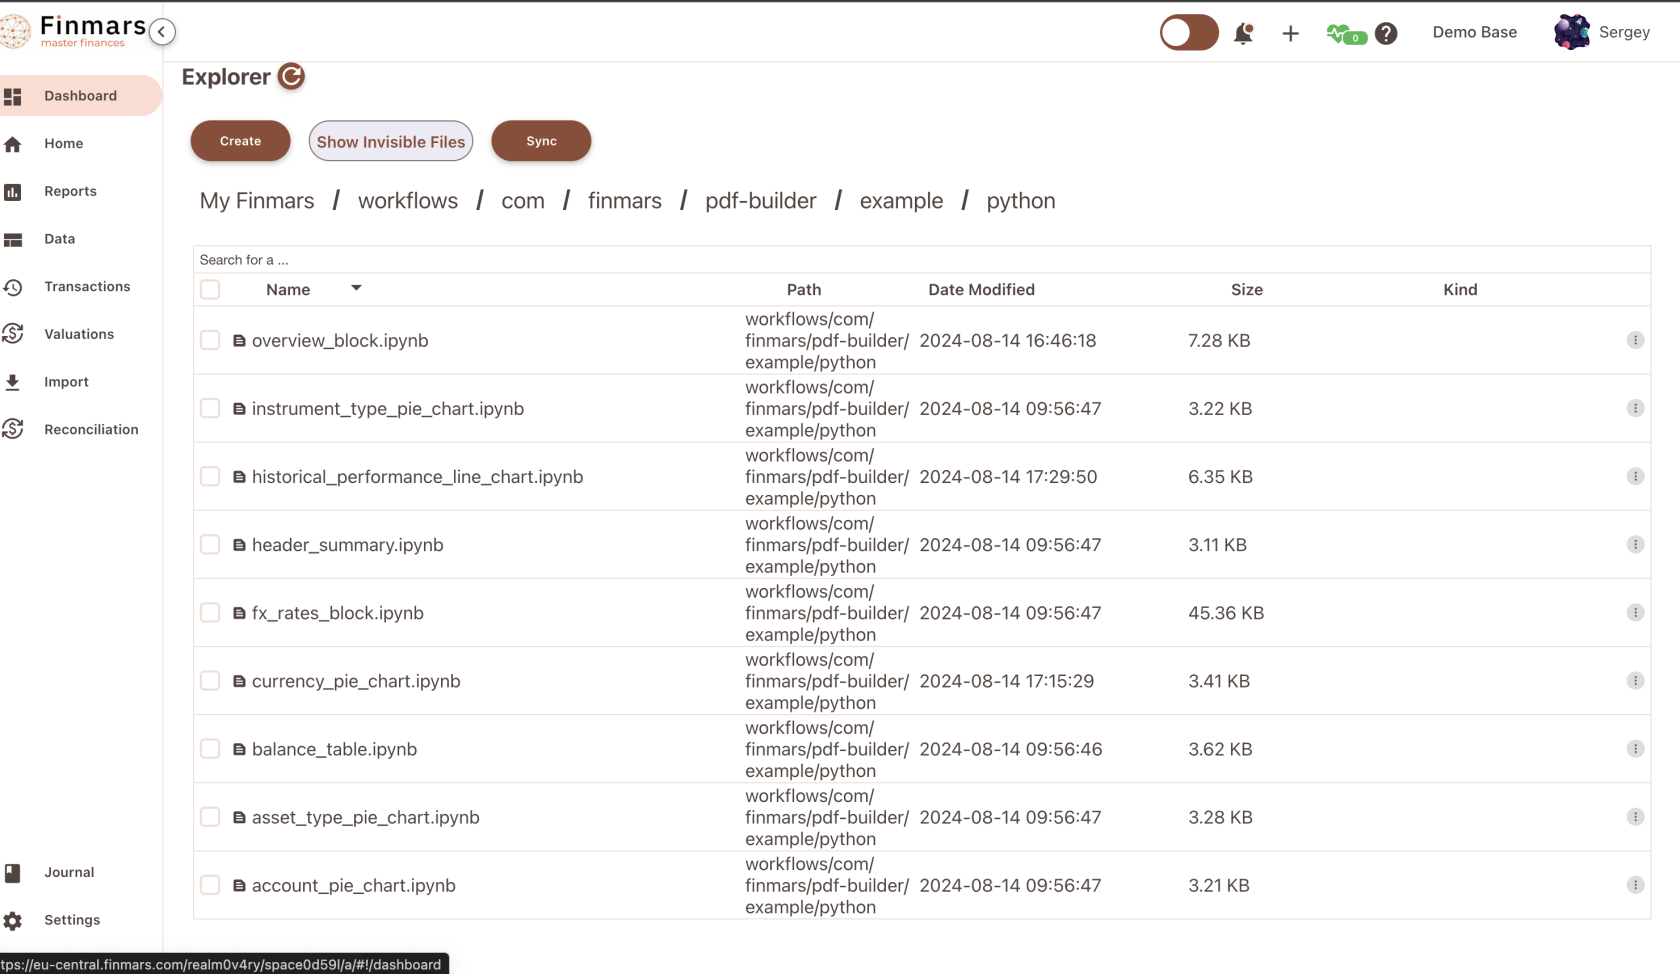](https://docs.finmars.com/uploads/images/gallery/2024-08/screenshot-2024-08-15-at-17-21-56.png)
So far we support two types of .ipynb scripts:
1\) Output Text Content (html, text, json, xml, etc)
2\) Output Img Content (basically for plotly charts)
Okay, lets sum it up, to create own report, here is list todo list:
1\) Create folder /workflows/com.finmars.pdf-builder/client-report (BTW you are not forced to use exact that path, you can create own modules, or if only for private use, pick any path you like)2) Copy report\_builder.html to /workflows/com.finmars.pdf-builder/client-report/client\_report\_builder.html
3) Create folder /workflows/com.finmars.pdf-builder/client-report/python
4) Create Example python file where /workflows/com.finmars.pdf-builder/client-report/python/test.ipynb
5) Add in first cell something like print("<h1>Hello World</h1>")
Thats it, you ready to start! Now you could dive into creating own PDF Report Template
Go to [https://docs.finmars.com/books/pdf-builder/page/creating-simple-report](https://docs.finmars.com/books/pdf-builder/page/creating-simple-report)
# Creating Simple Report
You finished your installation and ready to create new PDF Report Template
So you need to open your report\_builder.html in New Tab
[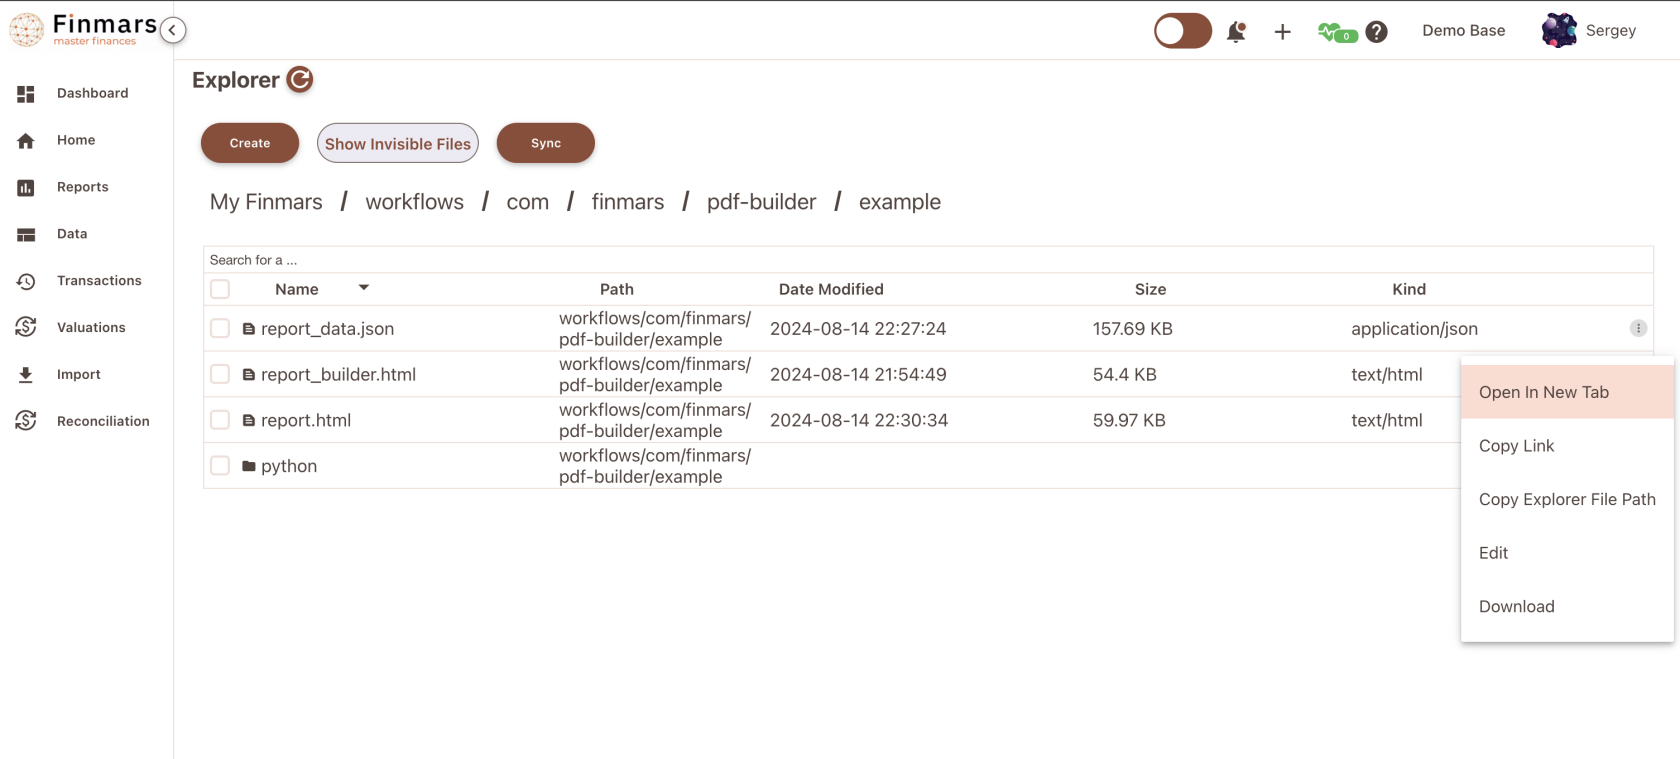](https://docs.finmars.com/uploads/images/gallery/2024-08/screenshot-2024-08-15-at-17-28-25.png)
Another thing to consider:if you use com.finmars.pdf-builder/example\_builder.html you **must pass query parameters** to run it
Example: ?report\_date=2023-09-11&portfolio=Bonds%20Portfolio
So in this example, we must declare **Portfolio User Code** and **Report Date** to make it run
[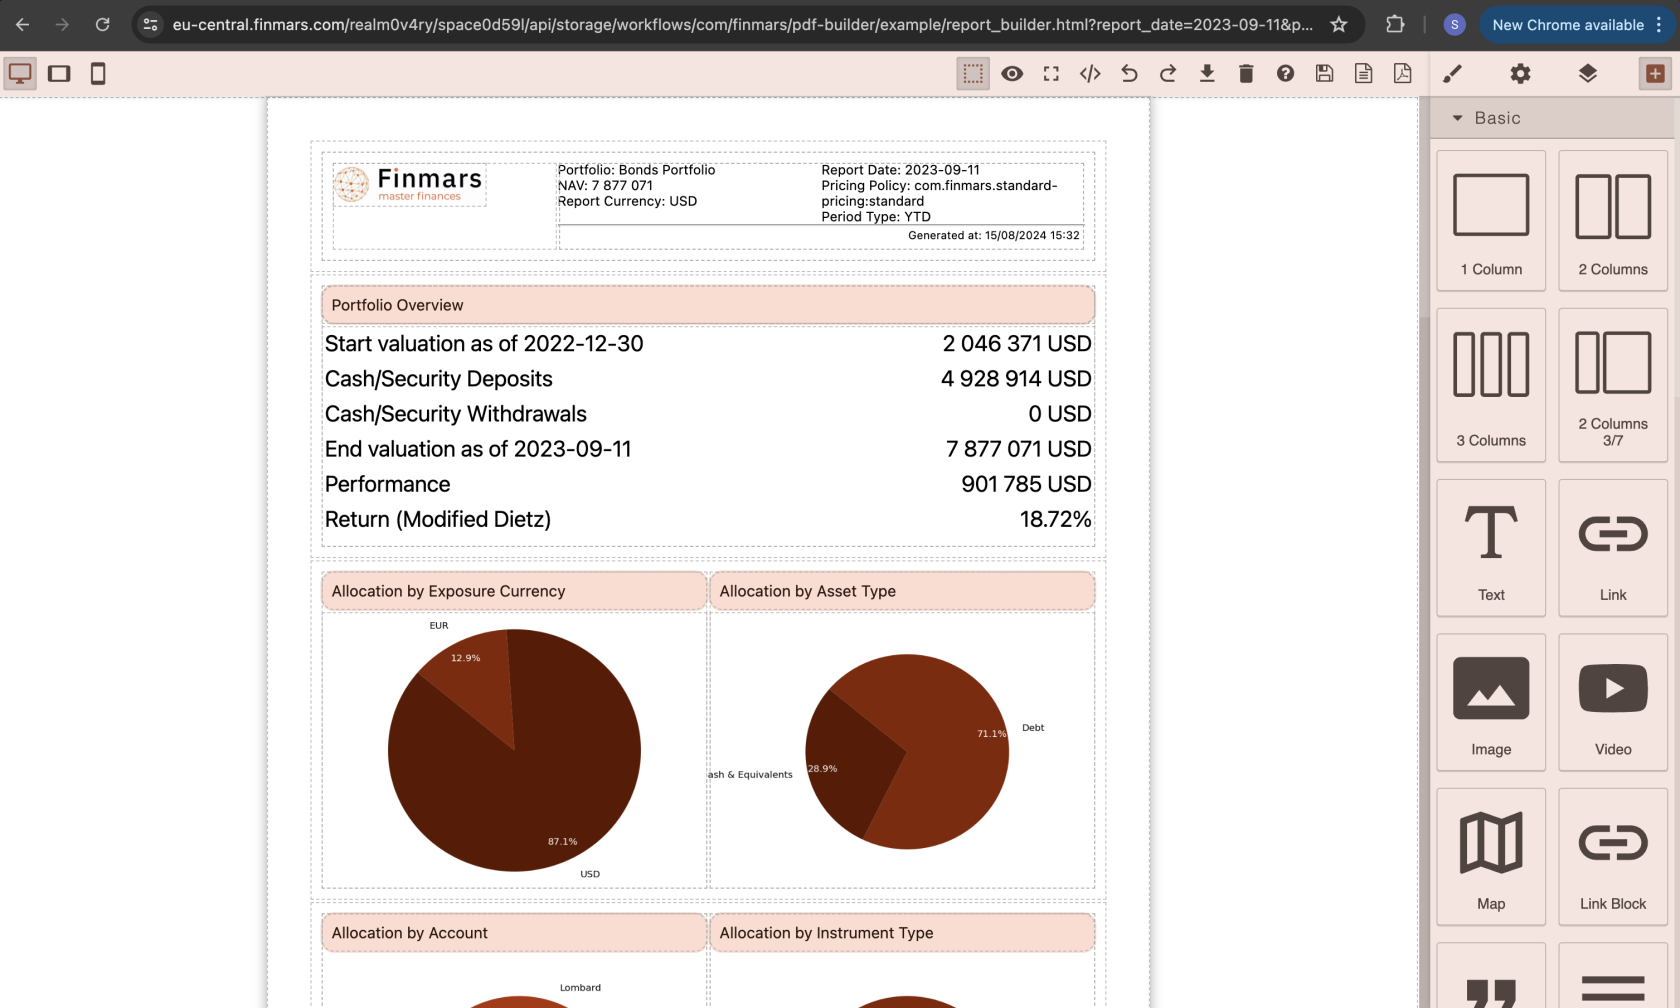](https://docs.finmars.com/uploads/images/gallery/2024-08/screenshot-2024-08-15-at-17-33-24.png)
But lets start from the begining
You can hover over elements and then you will see Delete Icon, if you press Element will be deleted
[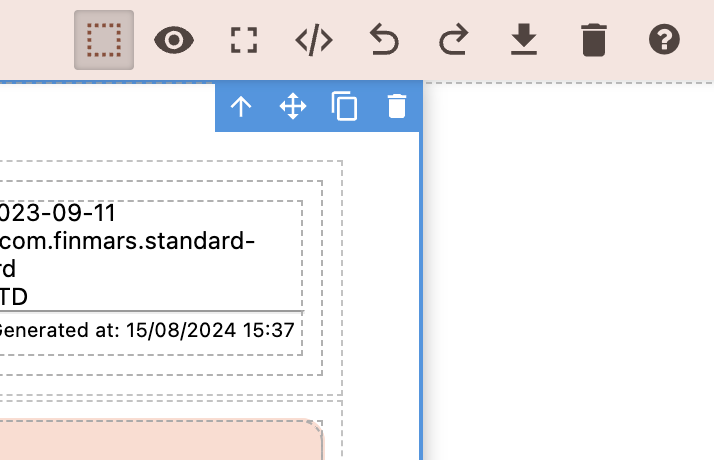](https://docs.finmars.com/uploads/images/gallery/2024-08/screenshot-2024-08-15-at-17-37-10.png)
Okay, I cleared all the canvas
[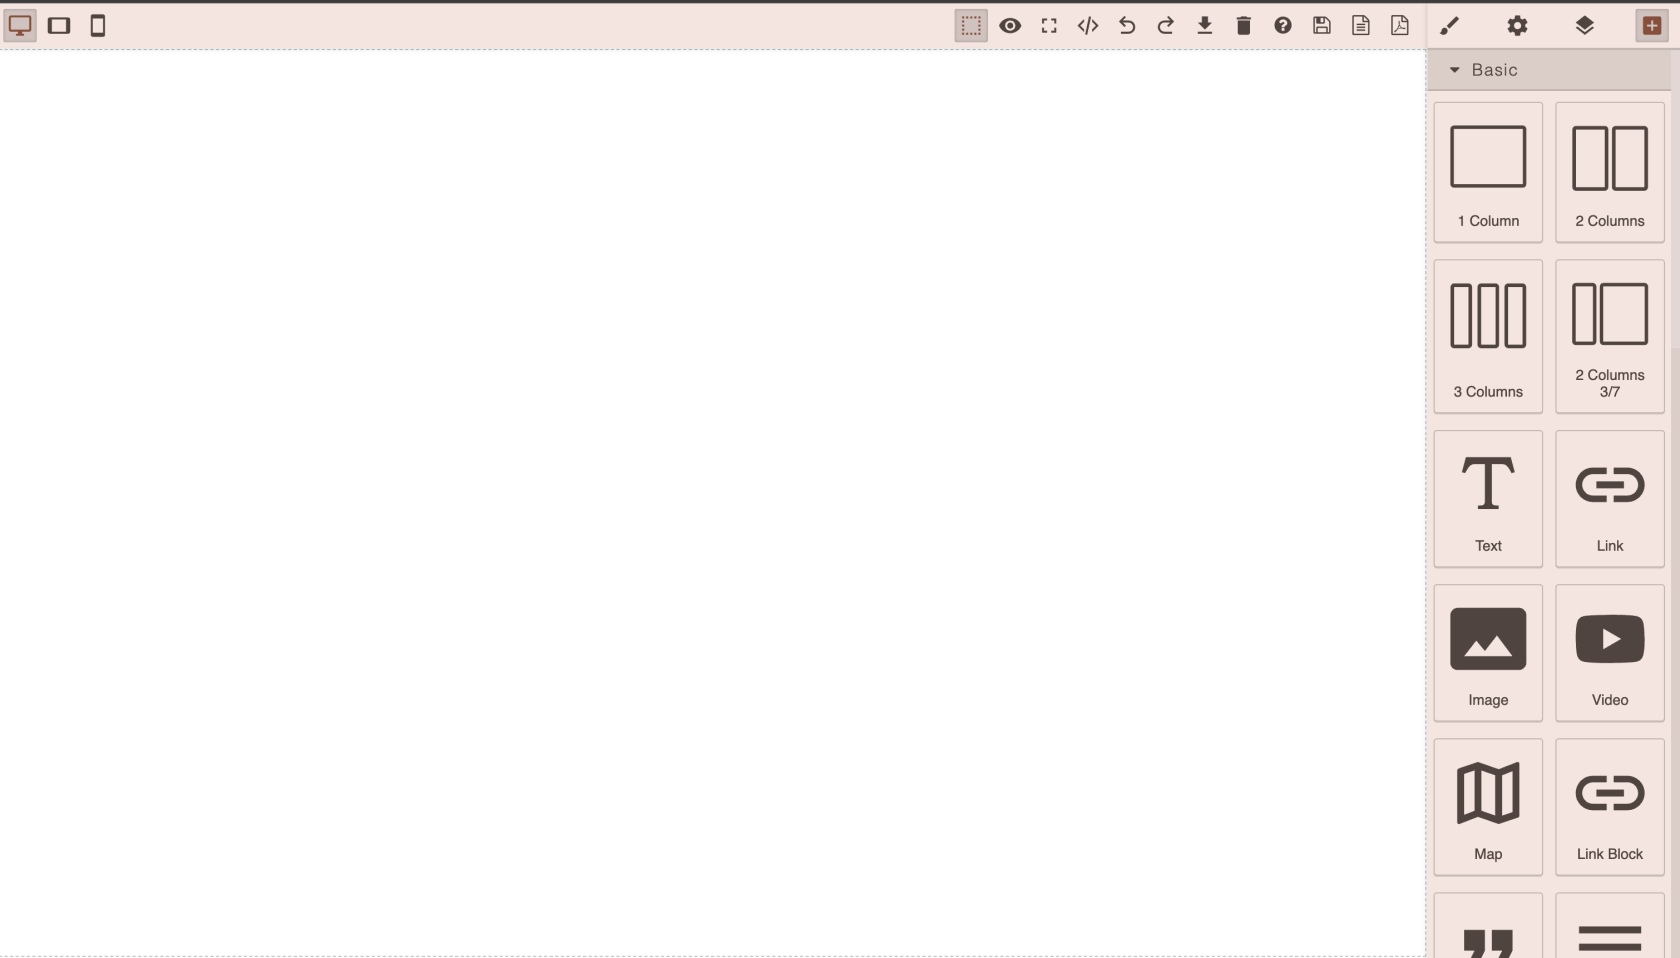](https://docs.finmars.com/uploads/images/gallery/2024-08/screenshot-2024-08-15-at-17-36-31.png)
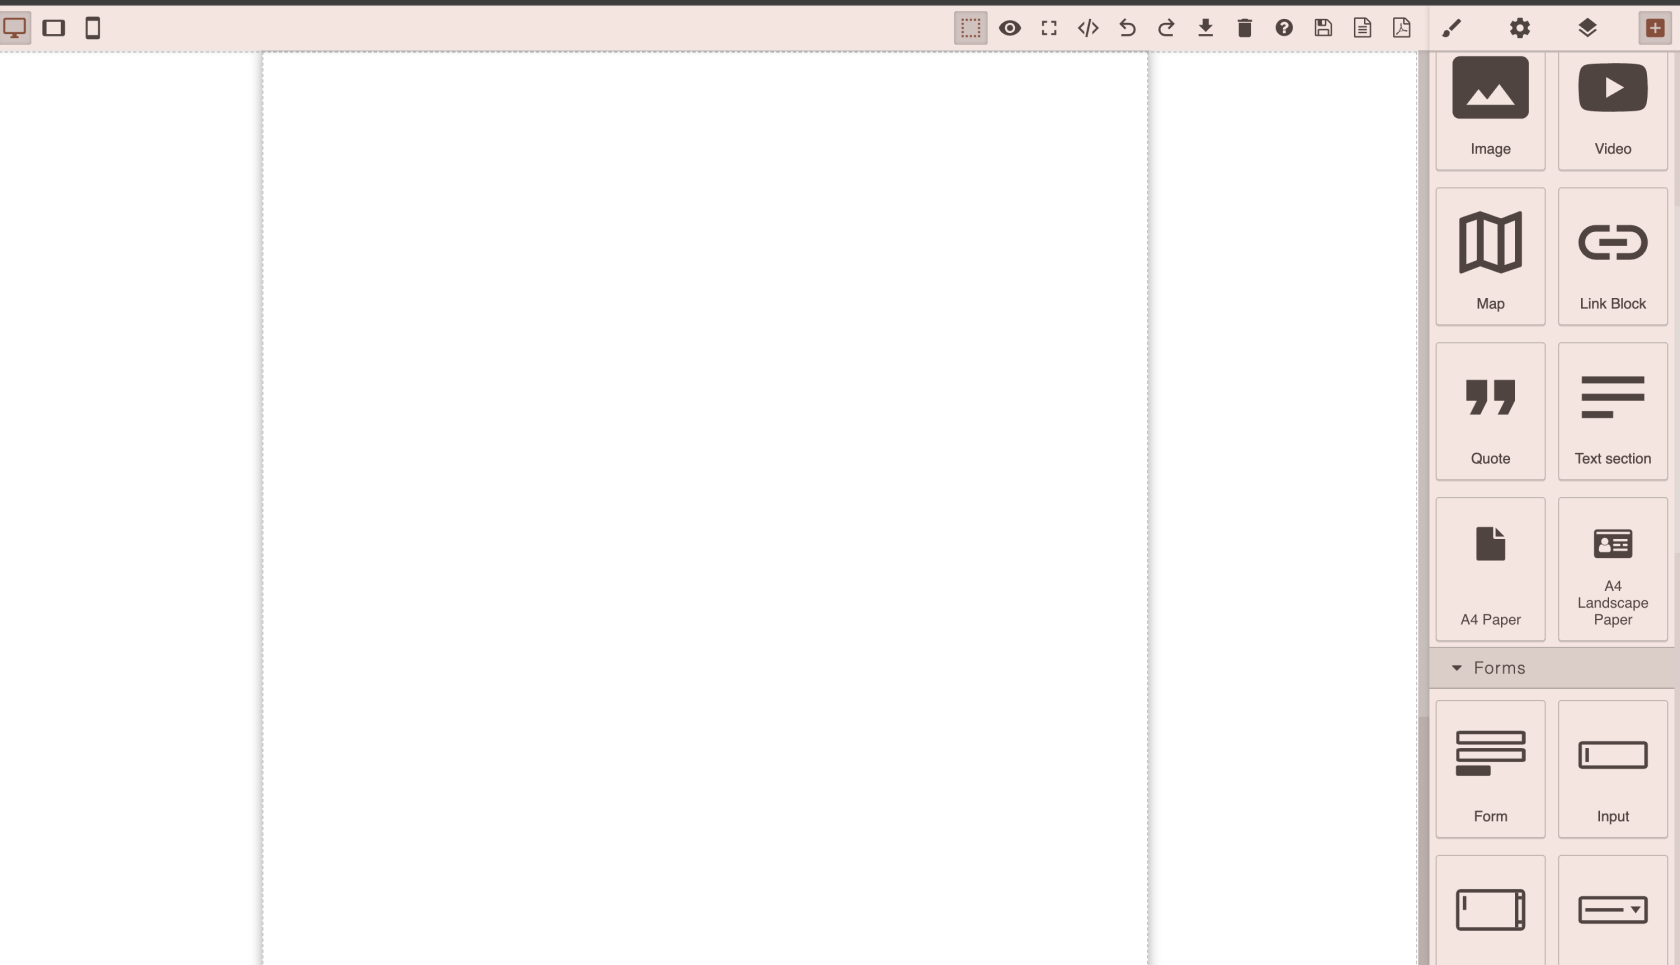
In Right Top corner you have square button with + sign, it will open menu of Blocks that can be places on canvas
Right now, I scrolled down and drag and dropped A4 Paper block on canvas. Simple as that!
[](https://docs.finmars.com/uploads/images/gallery/2024-08/screenshot-2024-08-15-at-17-38-36.png)
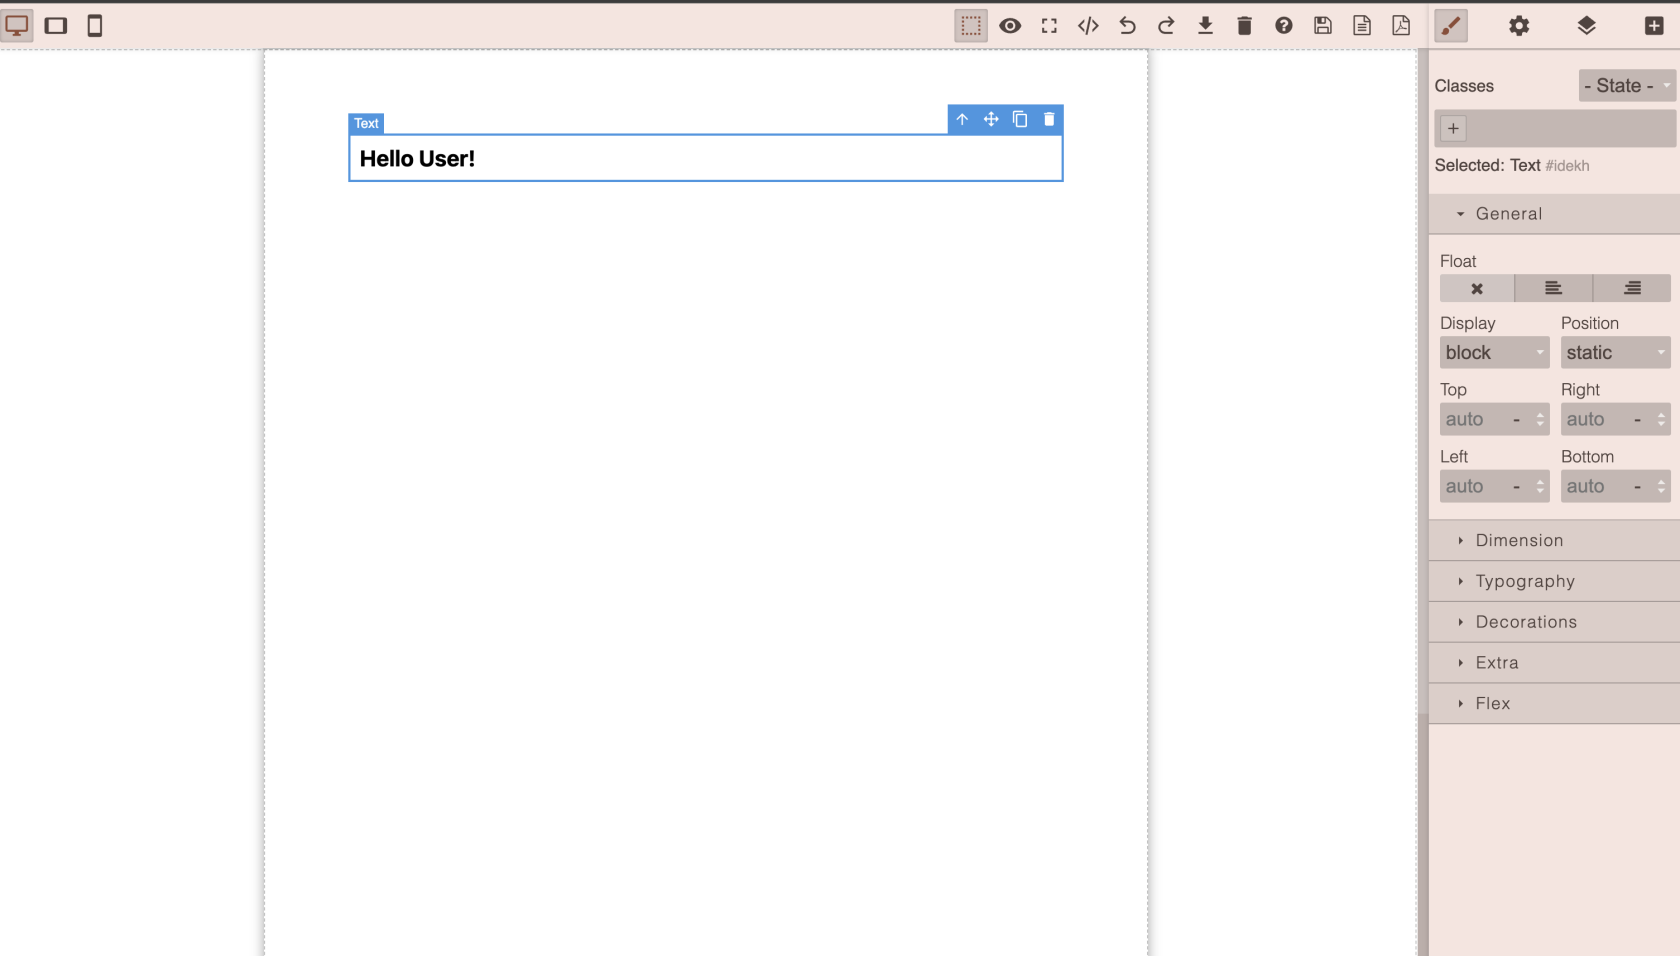
Now I can add some text!
[](https://docs.finmars.com/uploads/images/gallery/2024-08/screenshot-2024-08-15-at-17-39-44.png)
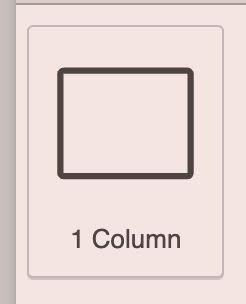
Lets Put this text into Card
So I wrapped my text with
[](https://docs.finmars.com/uploads/images/gallery/2024-08/screenshot-2024-08-15-at-18-00-48.png)
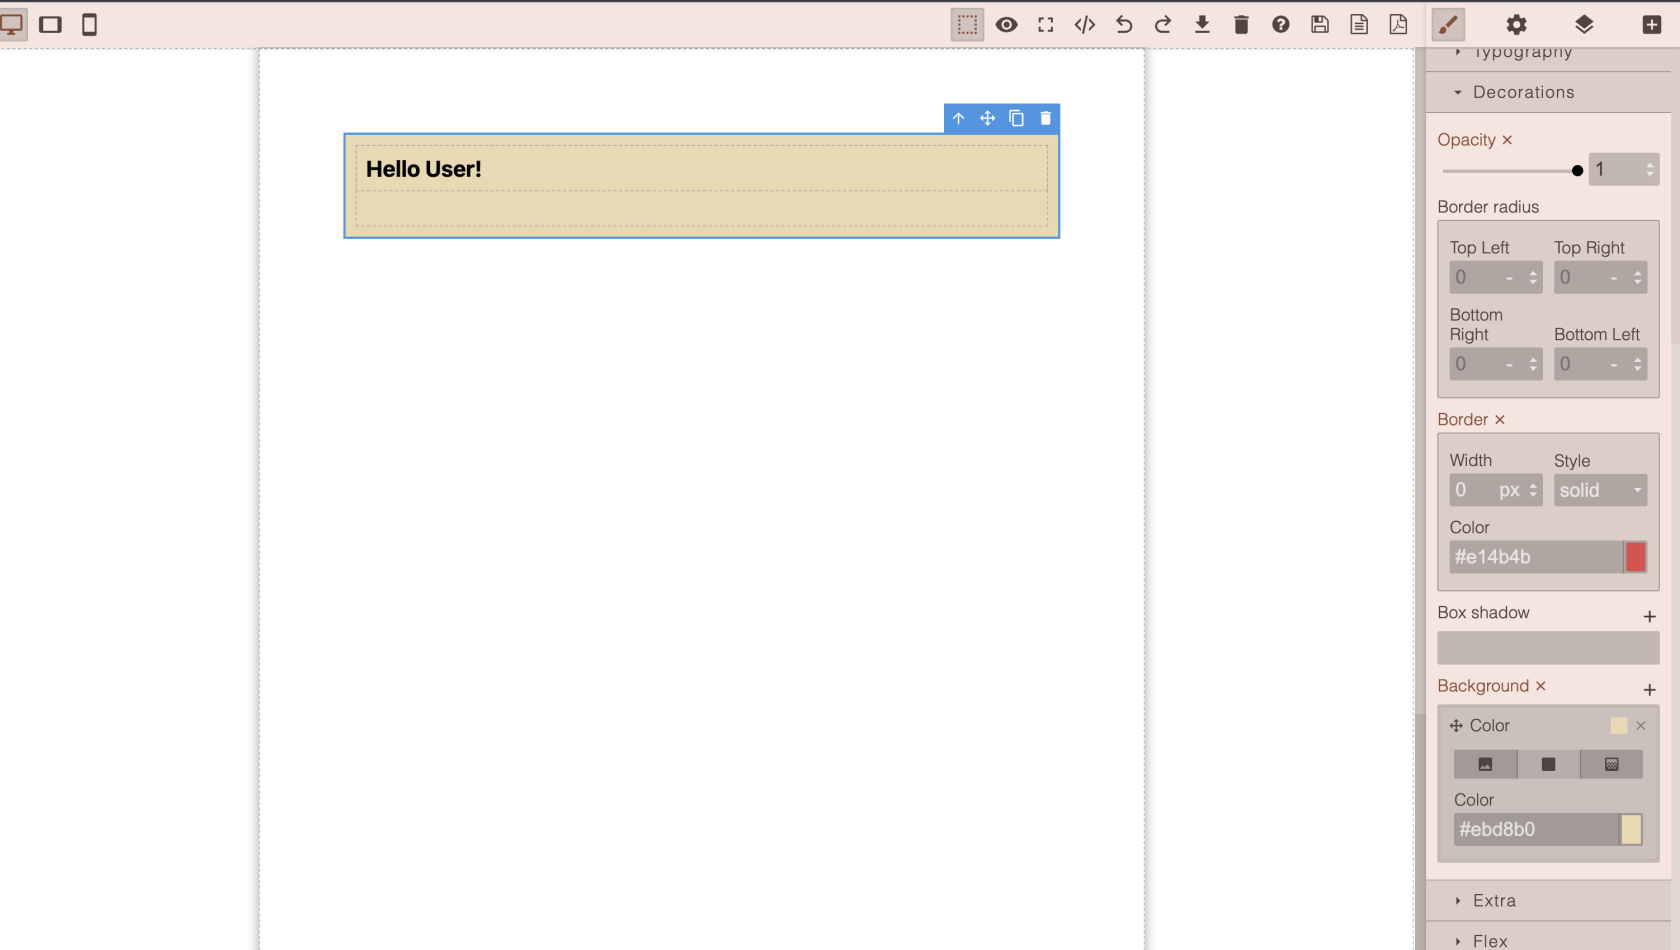
Then I click on that element and now my right sidebar has Brush Active Menu, scroll down to Decorations section, then add Background, any color you like
[](https://docs.finmars.com/uploads/images/gallery/2024-08/screenshot-2024-08-15-at-18-00-25.png)
So, lets test it, press export to PDF (its far right button with pdf icon)
[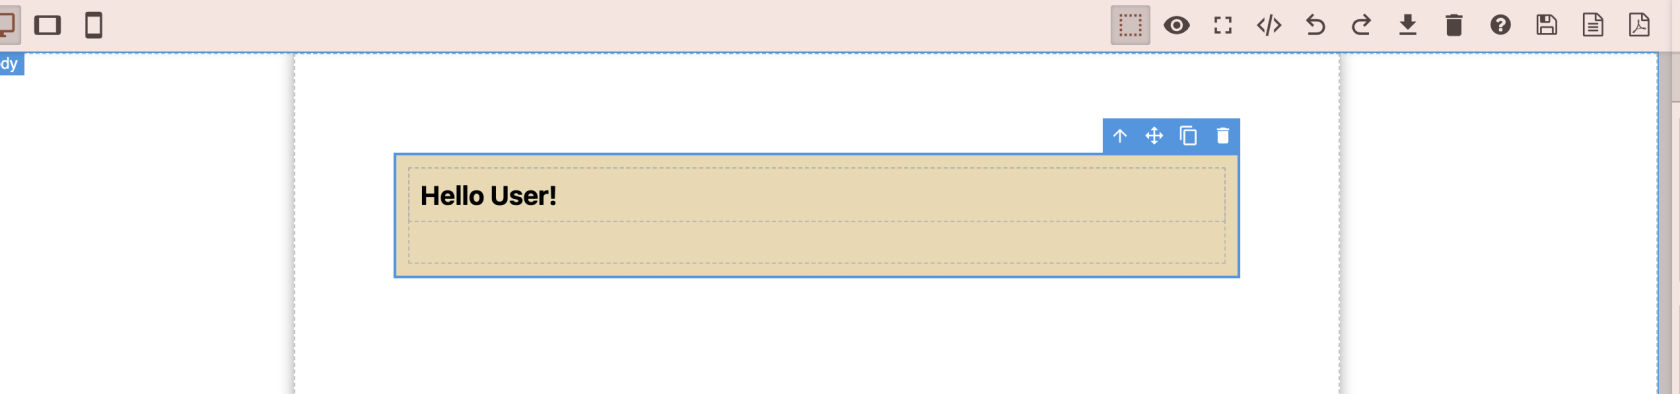](https://docs.finmars.com/uploads/images/gallery/2024-08/screenshot-2024-08-15-at-18-01-52.png)
Amazing, you created your first PDF report, well done!
[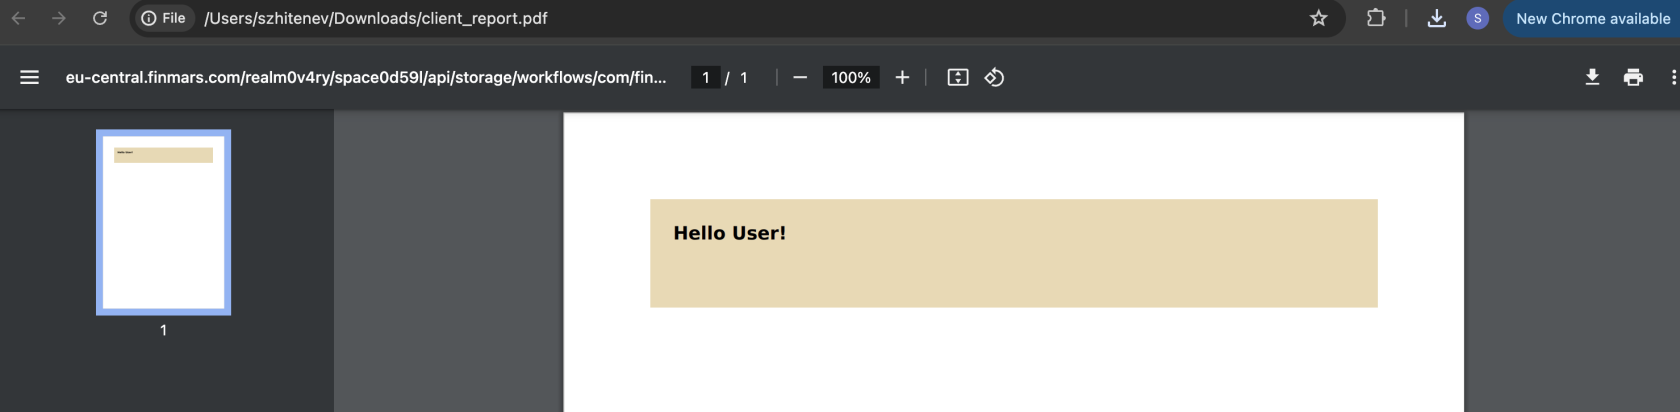](https://docs.finmars.com/uploads/images/gallery/2024-08/screenshot-2024-08-15-at-18-02-26.png)
Keep going! Go to [https://docs.finmars.com/books/pdf-builder/page/add-dynamic-content-to-your-pdf-report](https://docs.finmars.com/books/pdf-builder/page/add-dynamic-content-to-your-pdf-report)
# Add Dynamic Content to your PDF Report
Okay, we discover how to add static content, what about dynamic content? Lets find out
As I previously mention you have python/\* folder with your .ipynb scripts, lets create a simple python script python/example.ipynb
And lets output some content
```python
nav = 1000000
report_currency = 'USD'
result = f"
NAV: {nav} {report_currency}
"
print(result)
```
[](https://docs.finmars.com/uploads/images/gallery/2024-08/screenshot-2024-08-15-at-18-13-38.png)
Well done, lets go back to our PDF Builder
[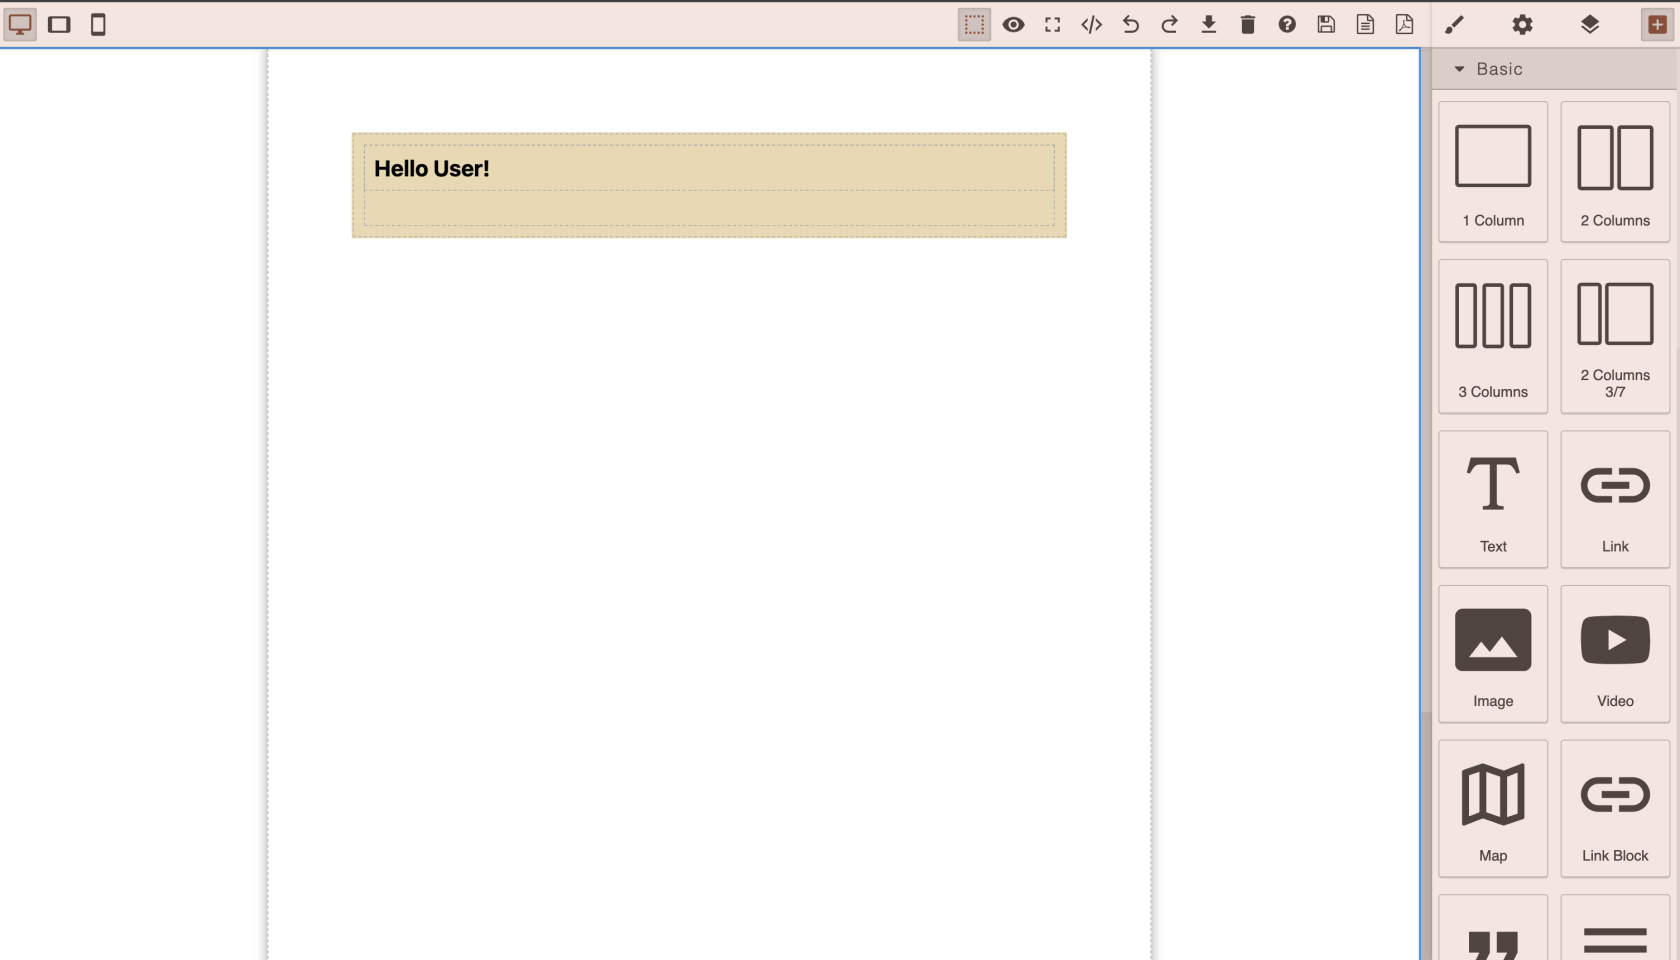](https://docs.finmars.com/uploads/images/gallery/2024-08/screenshot-2024-08-15-at-18-08-07.png)
Scroll down and find Block - **Python HTML Block**, drop it on canvas
[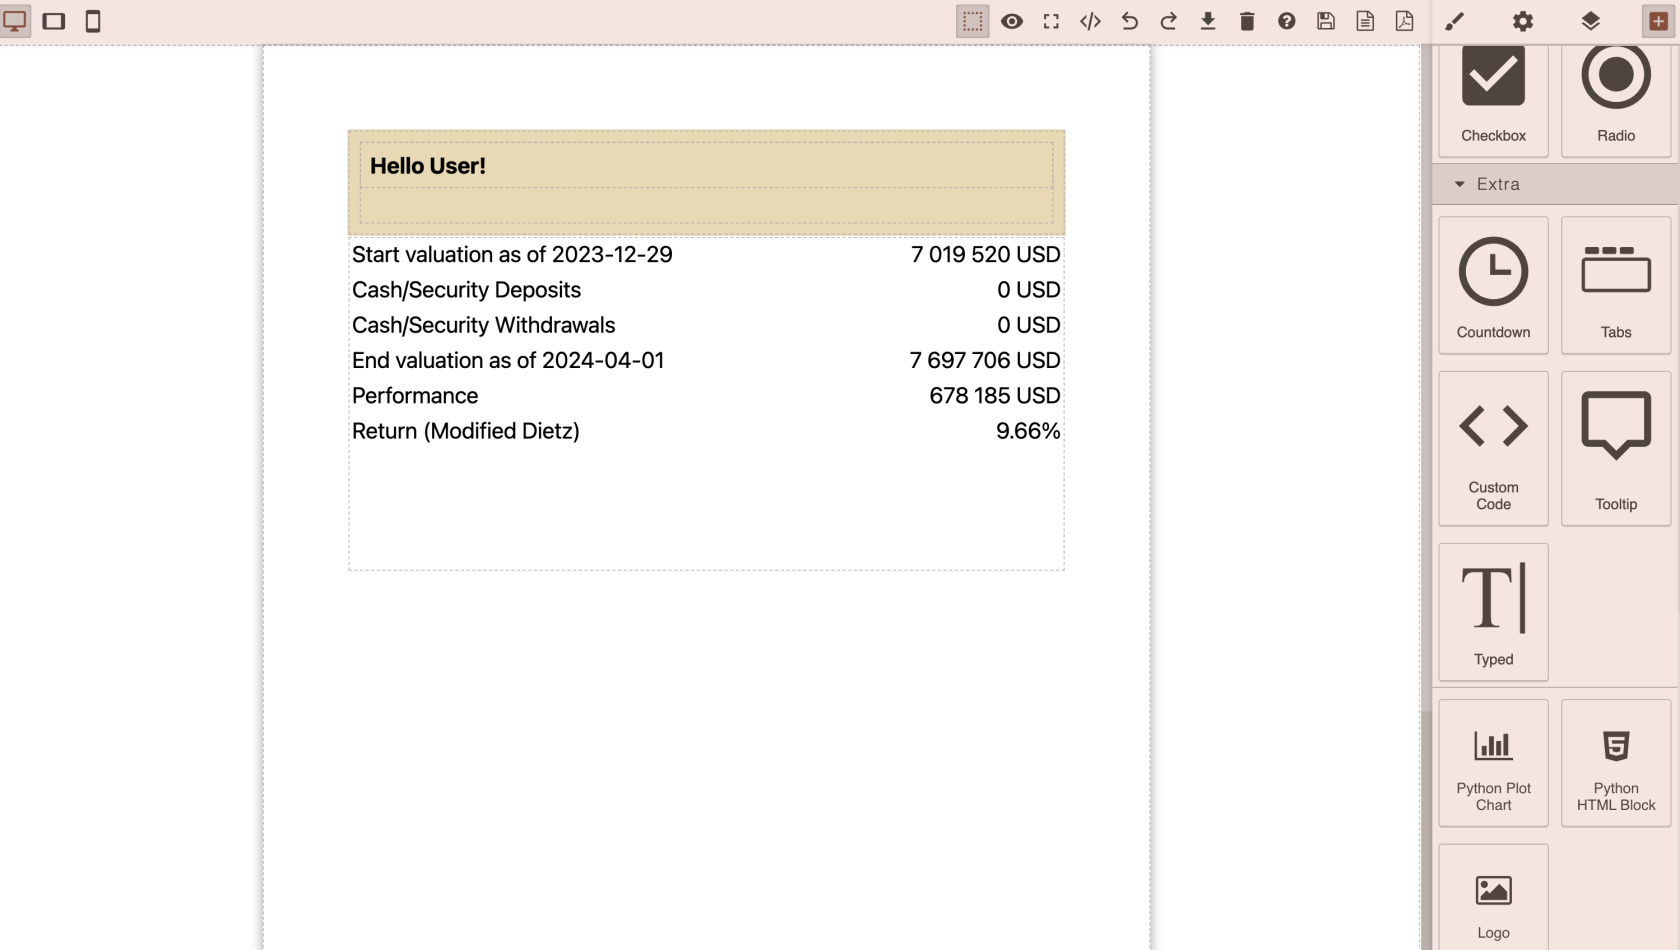](https://docs.finmars.com/uploads/images/gallery/2024-08/screenshot-2024-08-15-at-18-08-41.png)
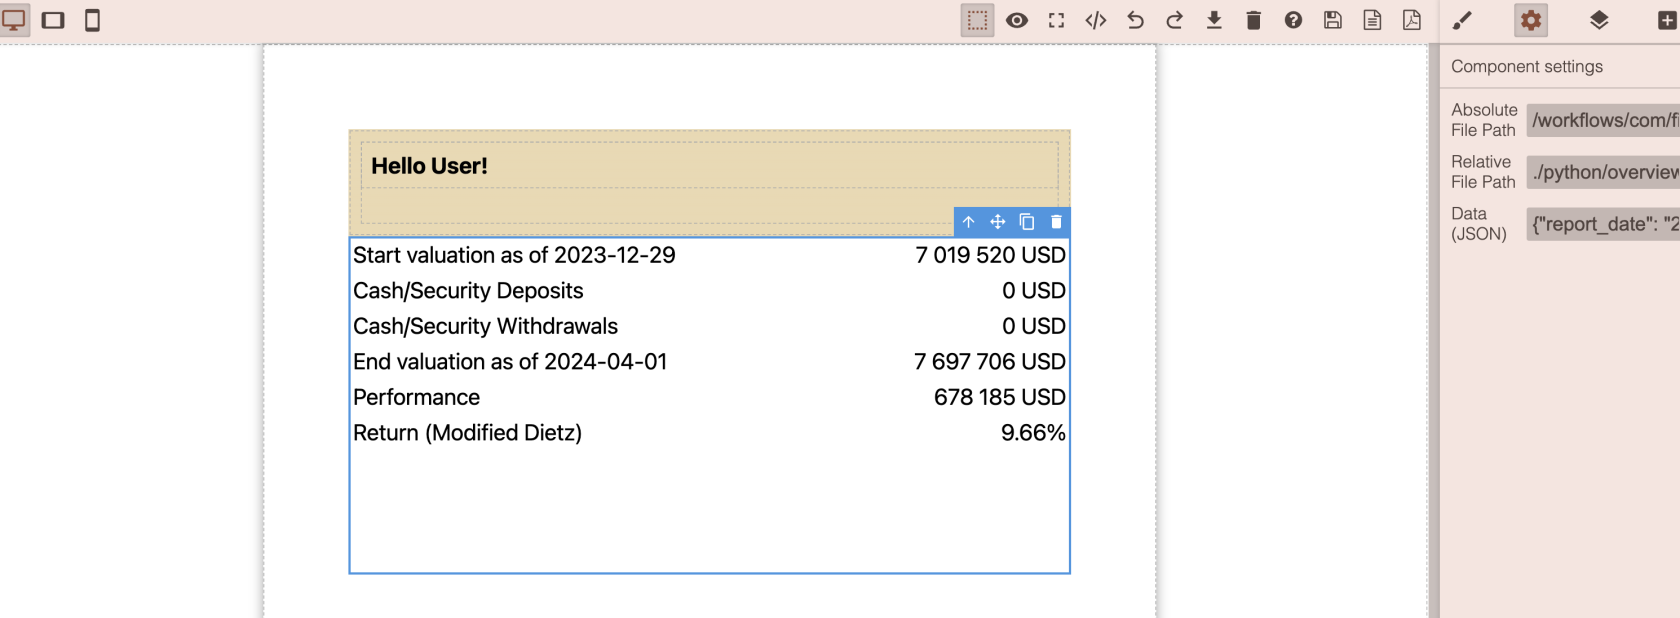
Then click on it, and let see the Block Settings (On right sidebar, cog button)
[](https://docs.finmars.com/uploads/images/gallery/2024-08/screenshot-2024-08-15-at-18-09-34.png)
So we have here 3 inputs
**Absolute File Path** - full path from root (/) of your Space Storage
**Relative File Path** - path from your builder location, so you can do like .python/example.ipynb
**Data (JSON)** - json field that could have some predefined settings for you .ipynb script
NOTA BENE: Relative File Path when set, it overrides Absolute File Path, so if you dont need relative path, just set it to null and use absolute path, otherwise, dont use Absolute File Path, when you type Relative File Path it will automatically calculated and passed to Absolute File Path
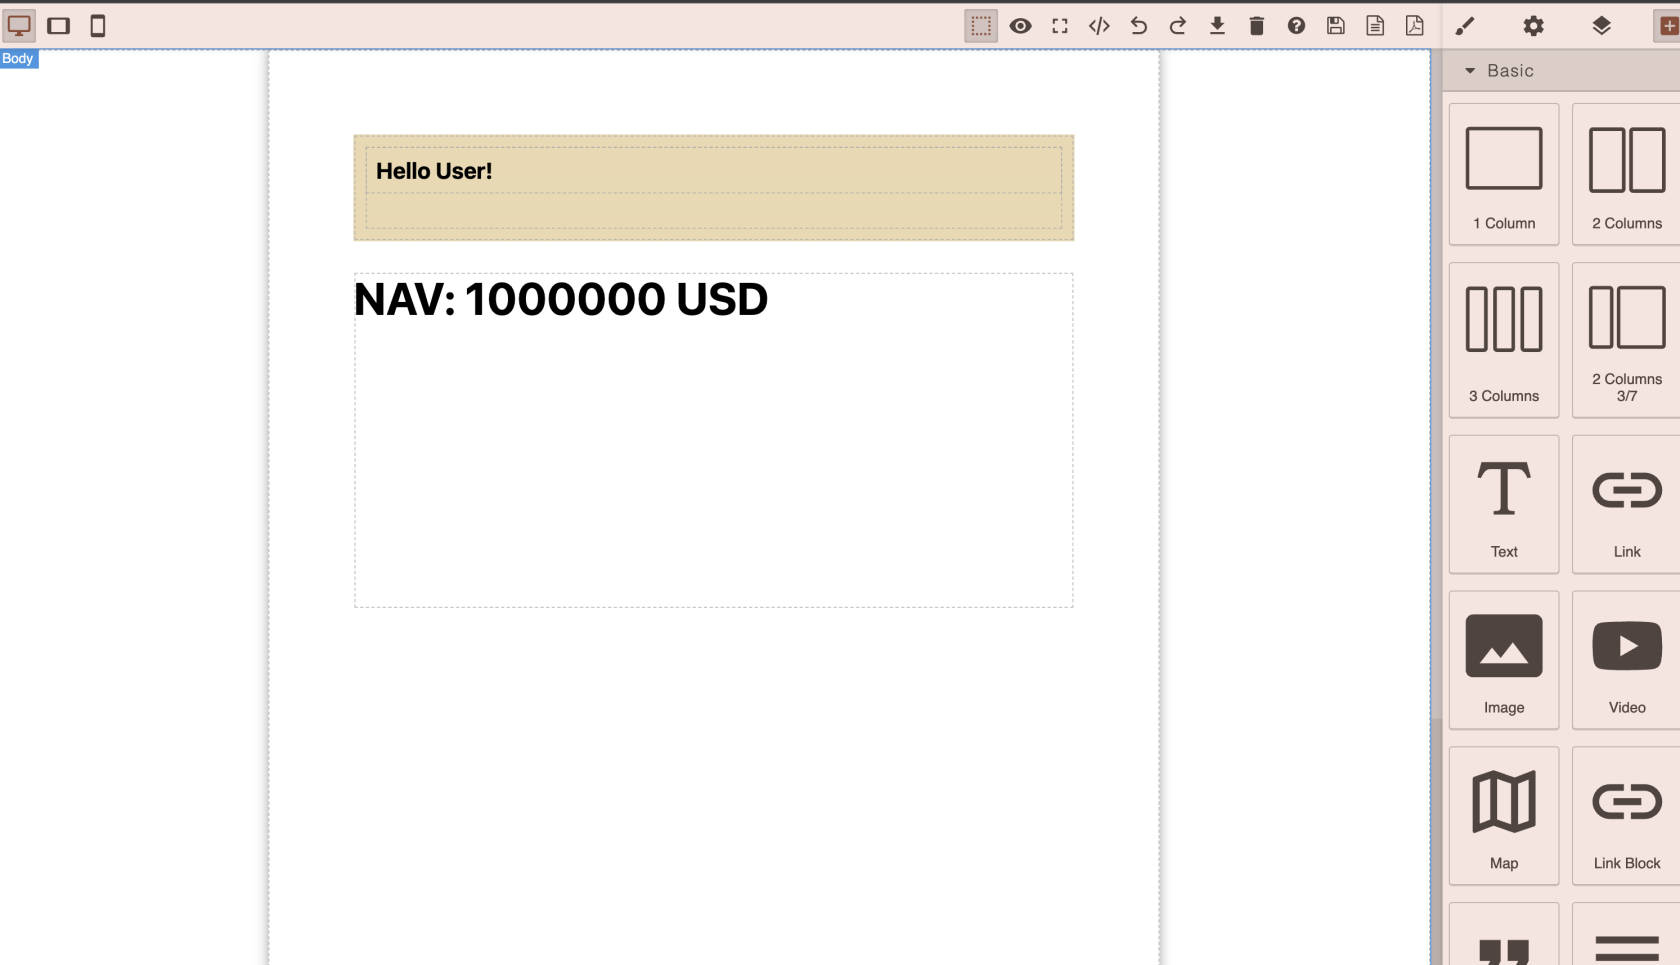
Lets put ./python/example.ipynb and see what will happen
[](https://docs.finmars.com/uploads/images/gallery/2024-08/screenshot-2024-08-15-at-18-14-00.png)
Great, now the result of your python/example.ipynb is executed and added to your PDF Template, well Done
But as you see, we just hardcoded NAV in .ipynb code, but we need to fetch it dynamically from Finmars REST API, lets do it!
So, we need to output some NAV, but what NAV?
Do make it all work, we need to now at least two things, Report Date and Portfolio
So, what to do? To achieve that, you can just pass it as Query Parameters, so
/example/client\_report\_builder.html?report\_date=2024-08-10&portfolio=Bonds%20Portfolio
Simple as that, all your Blocks that you put on canvas will listen to your Query Parameters, but how to access them?
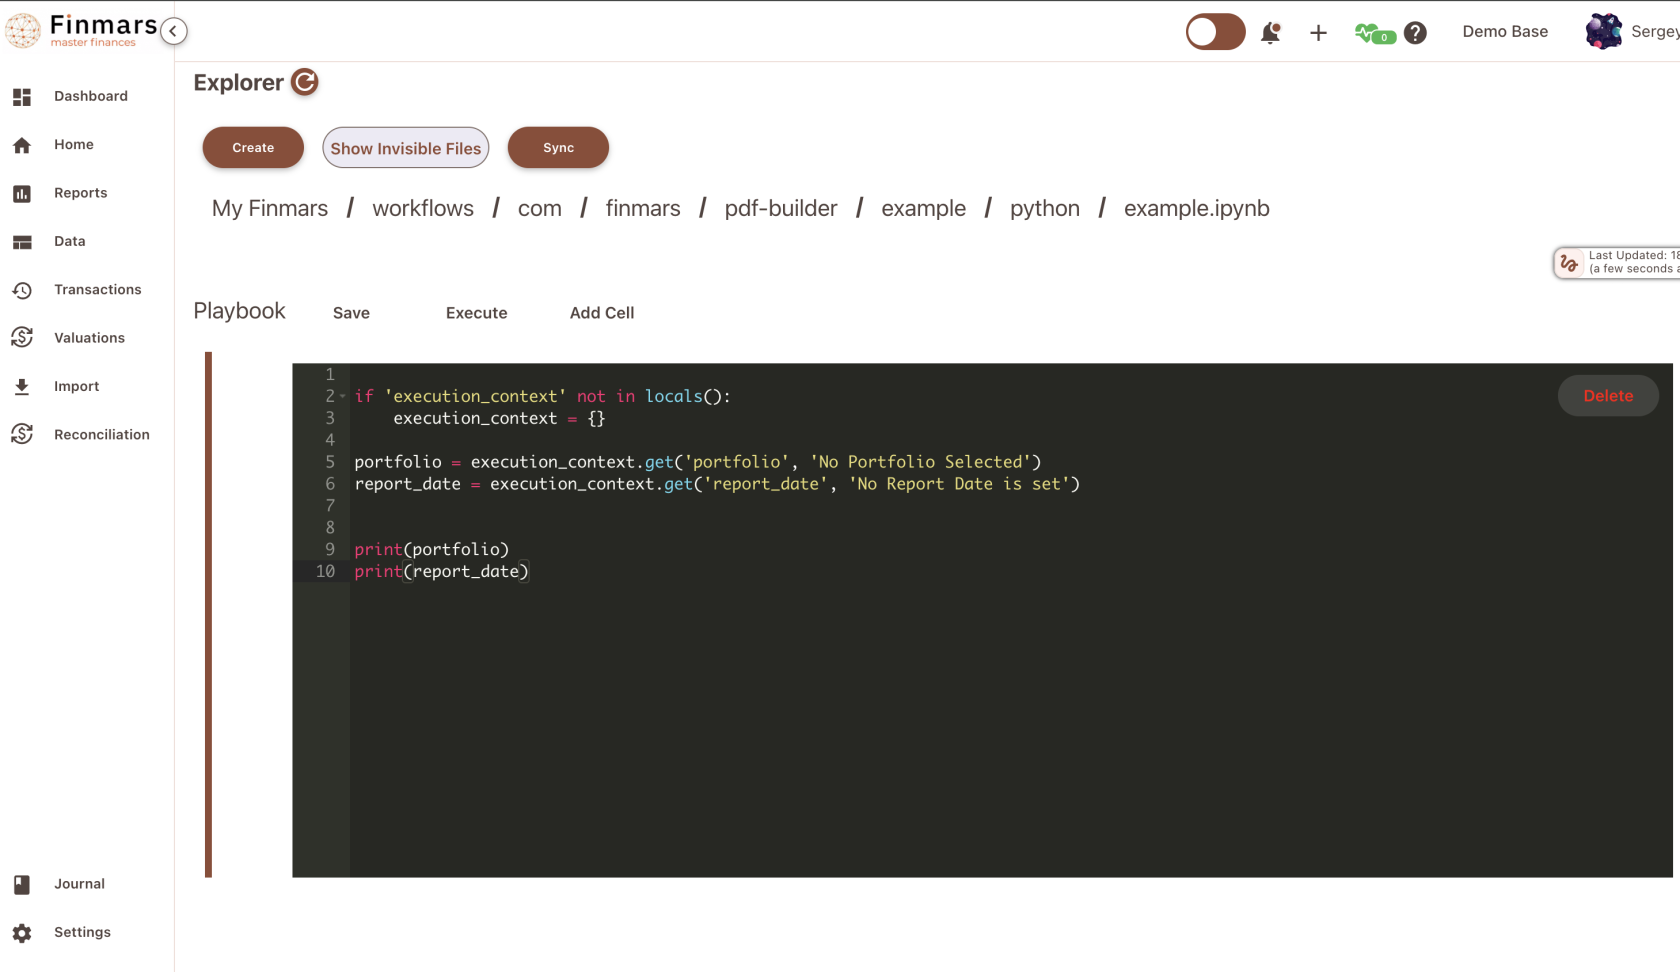
In your .ipynb script before it will be executed, Finmars fills out special variable **execution\_context**
So, try it!
```python
if 'execution_context' not in locals():
execution_context = {}
portfolio = execution_context.get('portfolio', 'No Portfolio Selected')
report_date = execution_context.get('report_date', 'No Report Date is set')
print(portfolio)
print(report_date)
```
[](https://docs.finmars.com/uploads/images/gallery/2024-08/screenshot-2024-08-15-at-18-23-50.png)
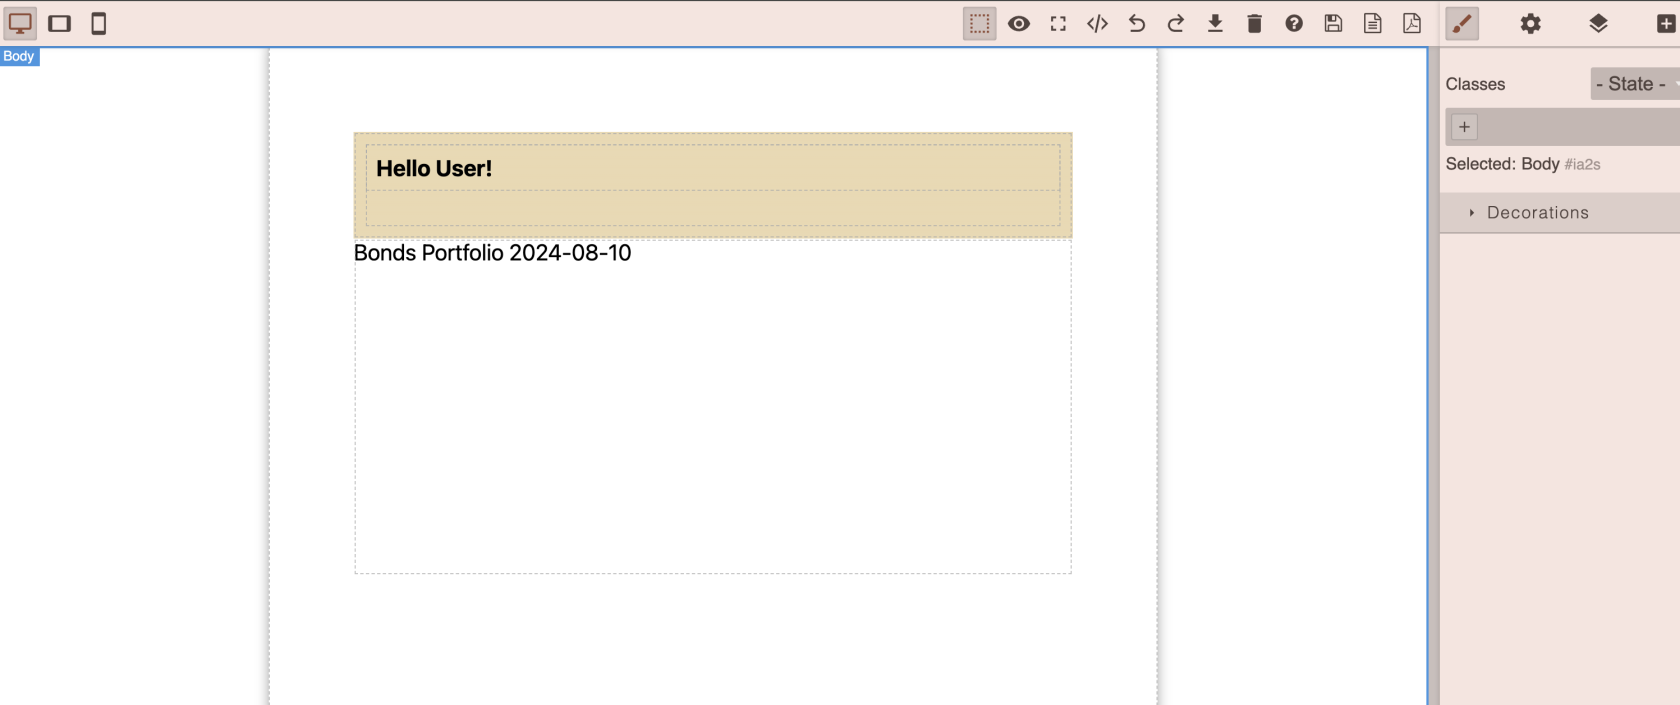
And the result!
[](https://docs.finmars.com/uploads/images/gallery/2024-08/screenshot-2024-08-15-at-18-24-17.png)
Great, now we can pass Parameters to our .ipynb script, to make it dynamic! Lets back to NAV
To achieve that, we must make a request to Finmars REST API, so it will calculate for us Balance Report, and we can took NAV from it.
To make it work, we need to import request\_api from workflow.finmars (Yes, everything executed in Workflow Service) to achieve security Finmars REST API is isolated from Workflow User Scripts
```python
import requests
from workflow.finmars import request_api
if 'execution_context' not in locals():
execution_context = {}
report_currency = execution_context.get('Valuation Currency', 'USD')
portfolio = execution_context.get('portfolio', 'No Portfolio Selected')
report_date = execution_context.get('report_date', 'No Report Date is set')
pricing_policy = execution_context.get('Pricing Policy', 'com.finmars.standard-pricing:standard')
def get_nav():
payload = {
"cost_method": 1,
"pricing_policy": pricing_policy,
"report_date": report_date,
"report_currency": report_currency,
"portfolios": [portfolio],
"frontend_request_options": {
"columns": [],
"filter_settings": [],
"groups_types": [],
"groups_values": []
}
}
response = request_api(f'/api/v1/reports/backend-balance-report/items/', method='POST', data=payload)
items = response["items"]
nav = 0
for item in items:
if item['market_value']:
nav = nav + item['market_value']
return f"{int(nav):,}".replace(',', ' ')
nav = get_nav()
print(f"
NAV {nav} {report_currency}
")
```
Okay, we made a request, we have list of positions and we just sum up all the market\_values to get our NAV. And here is result!
[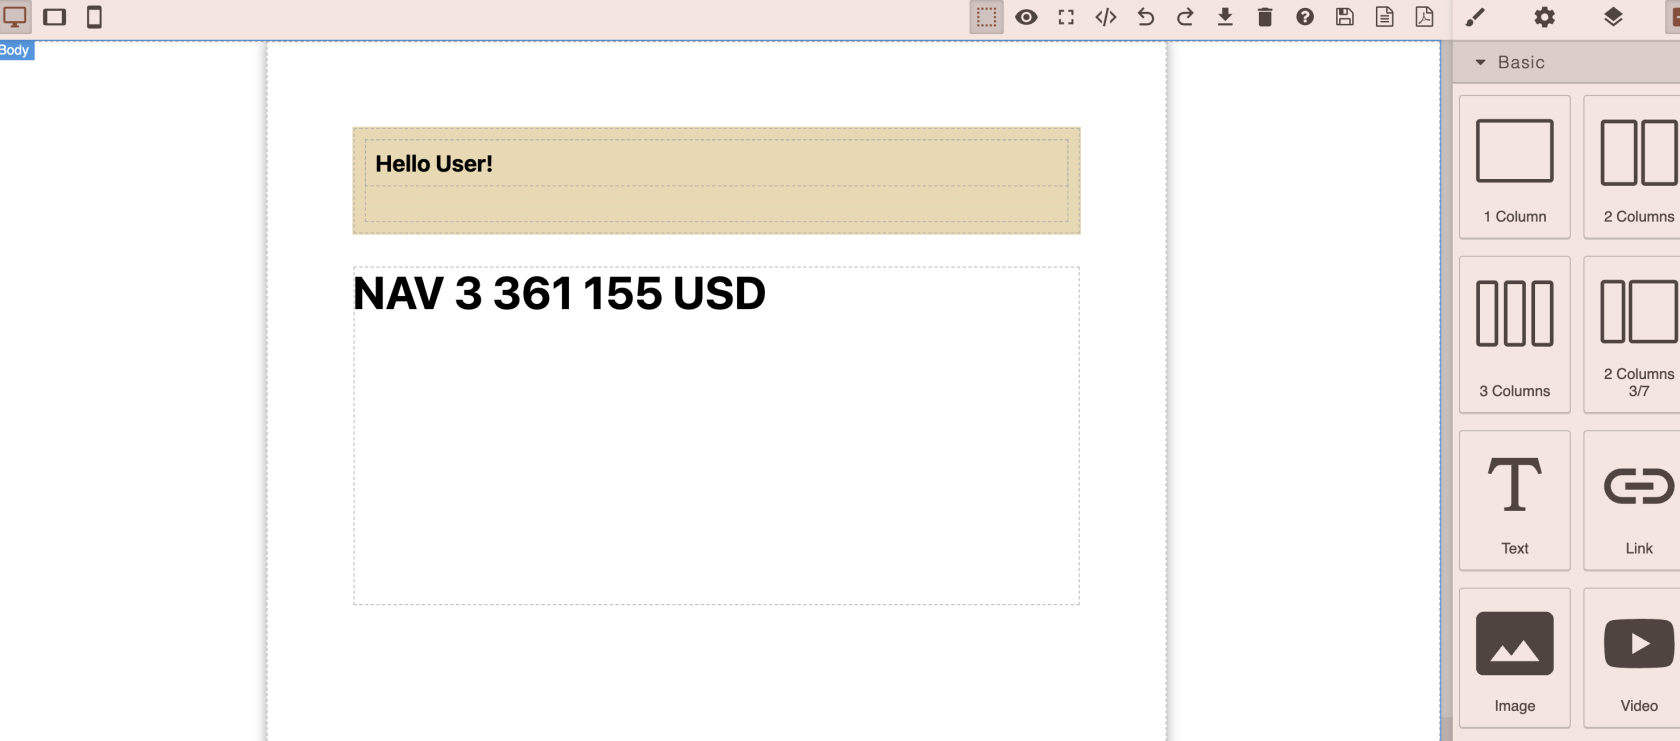](https://docs.finmars.com/uploads/images/gallery/2024-08/screenshot-2024-08-15-at-18-29-44.png)
And now we can change Portfolio, for example Equity Portfolio
[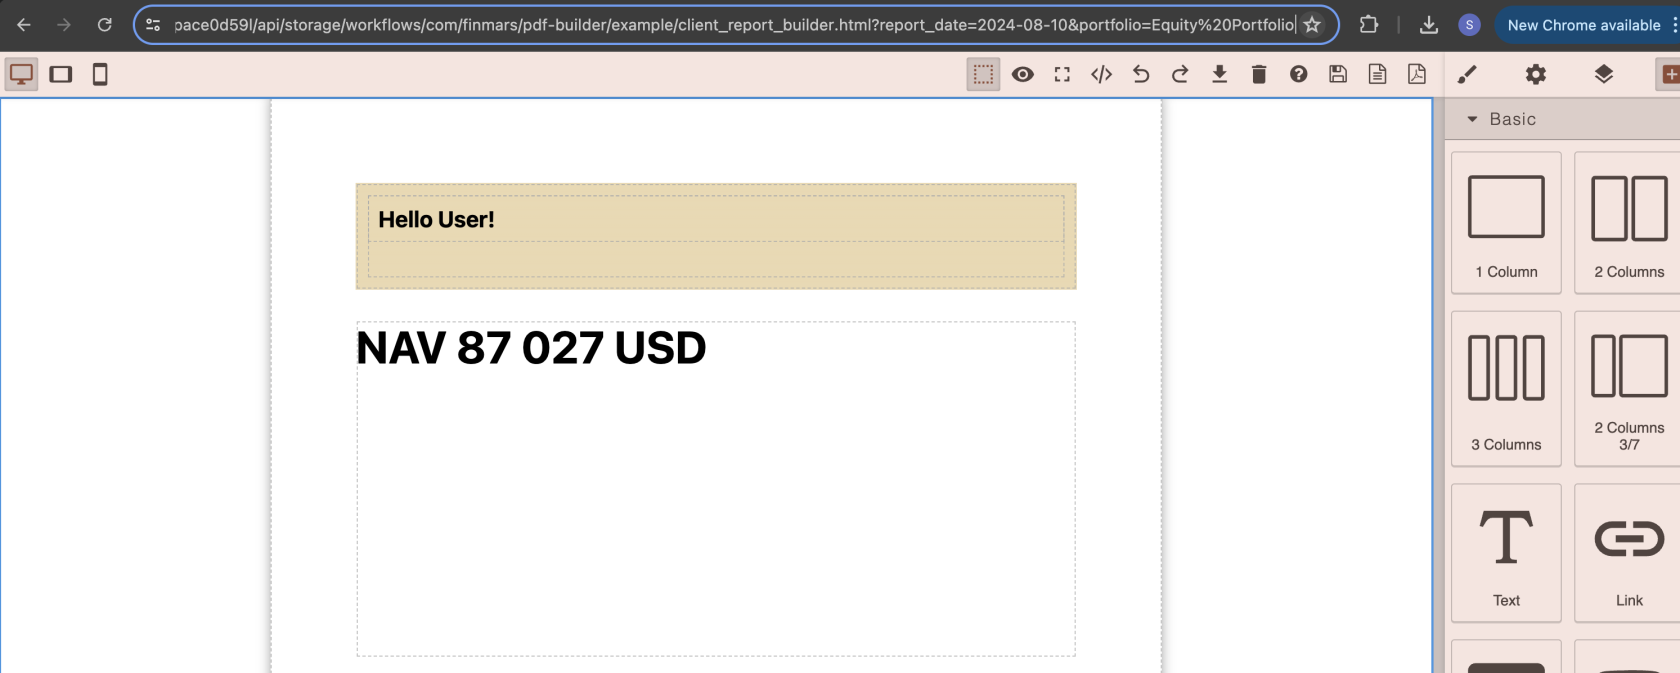](https://docs.finmars.com/uploads/images/gallery/2024-08/screenshot-2024-08-15-at-18-30-21.png)
We have a dynamic PDF Template and if we export it, it will all work!
Lets Add some more text and then print
[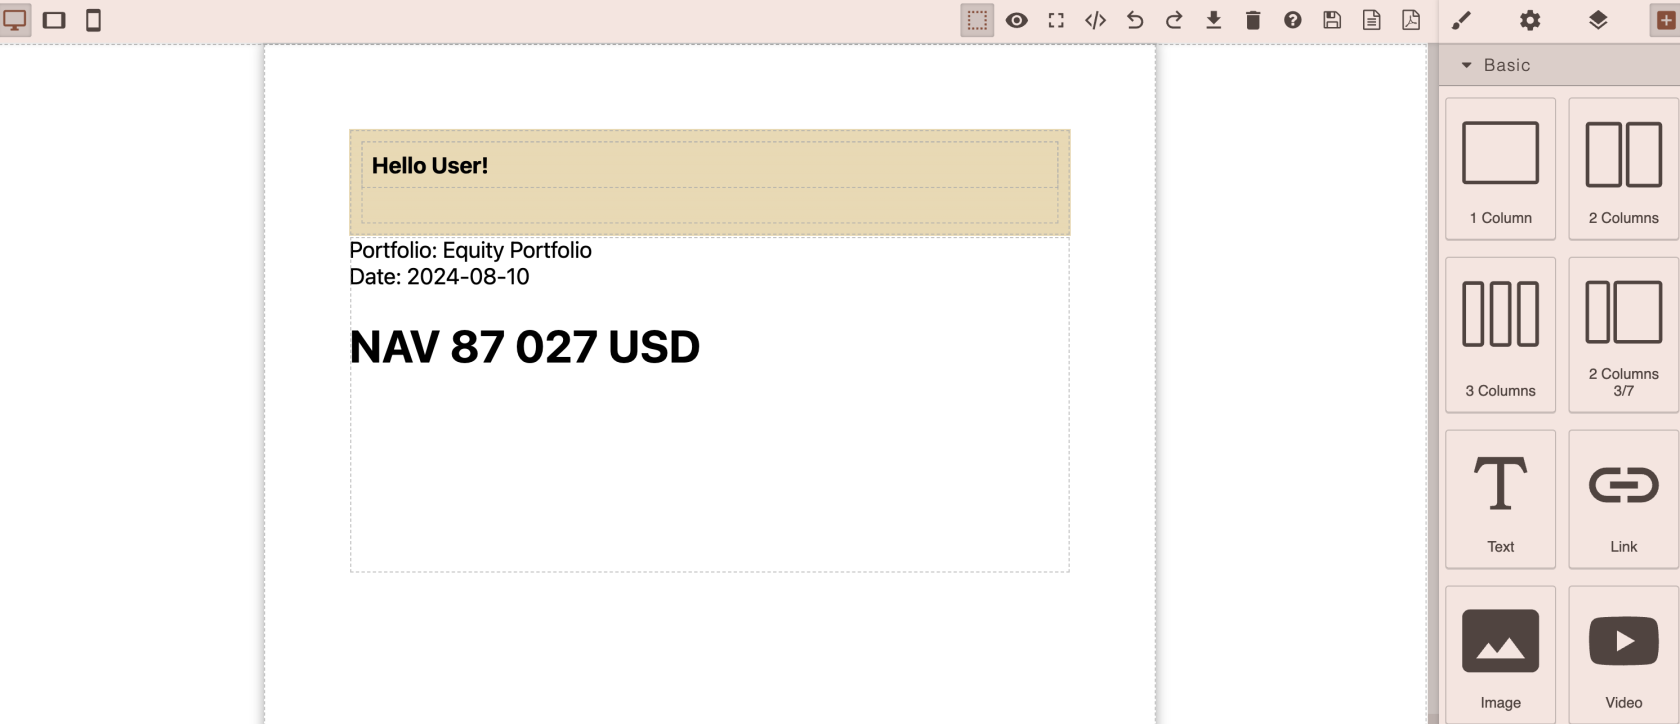](https://docs.finmars.com/uploads/images/gallery/2024-08/screenshot-2024-08-15-at-18-32-31.png)
And the result!
[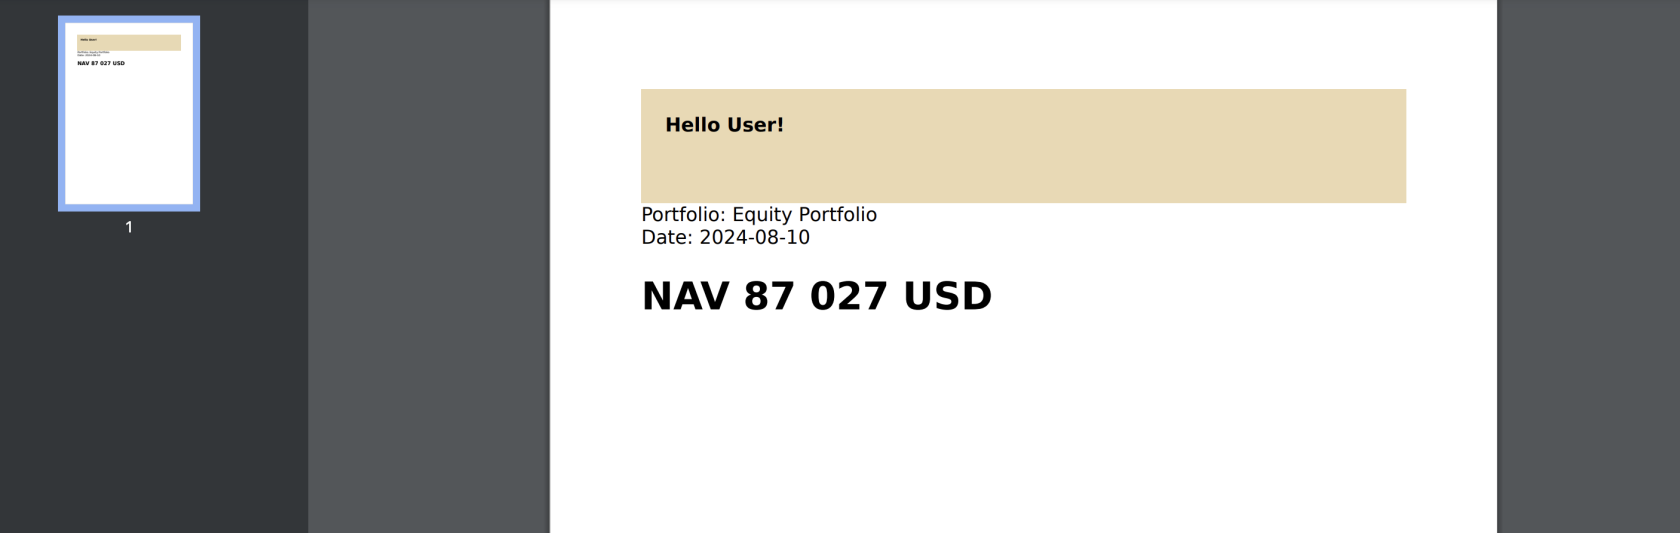](https://docs.finmars.com/uploads/images/gallery/2024-08/screenshot-2024-08-15-at-18-32-54.png)
Great work! Now lets move to next article, where we will add a Pie Chart. Go to [https://docs.finmars.com/books/pdf-builder/page/add-pie-chart-to-your-pdf-report](https://docs.finmars.com/books/pdf-builder/page/add-pie-chart-to-your-pdf-report)
P.S. But how it all work?
So each time when you work with PDF Builder, or its HTML Result, or send it to PDF Print Service each time your access\_token (Keycloak) or bearer\_token (Personal Access Token API) is in use. It means, generation will be done by your User and your IAM access Rights.
P.S.S In case of Workflow Schedules finmars\_bot will be used as User
# Add Pie Chart to Your PDF Report
In this article you will learn how to add various charts to your PDF Report. Lets start!
So, you have your canvas, lets drop new block there **Python Plot Chart**
[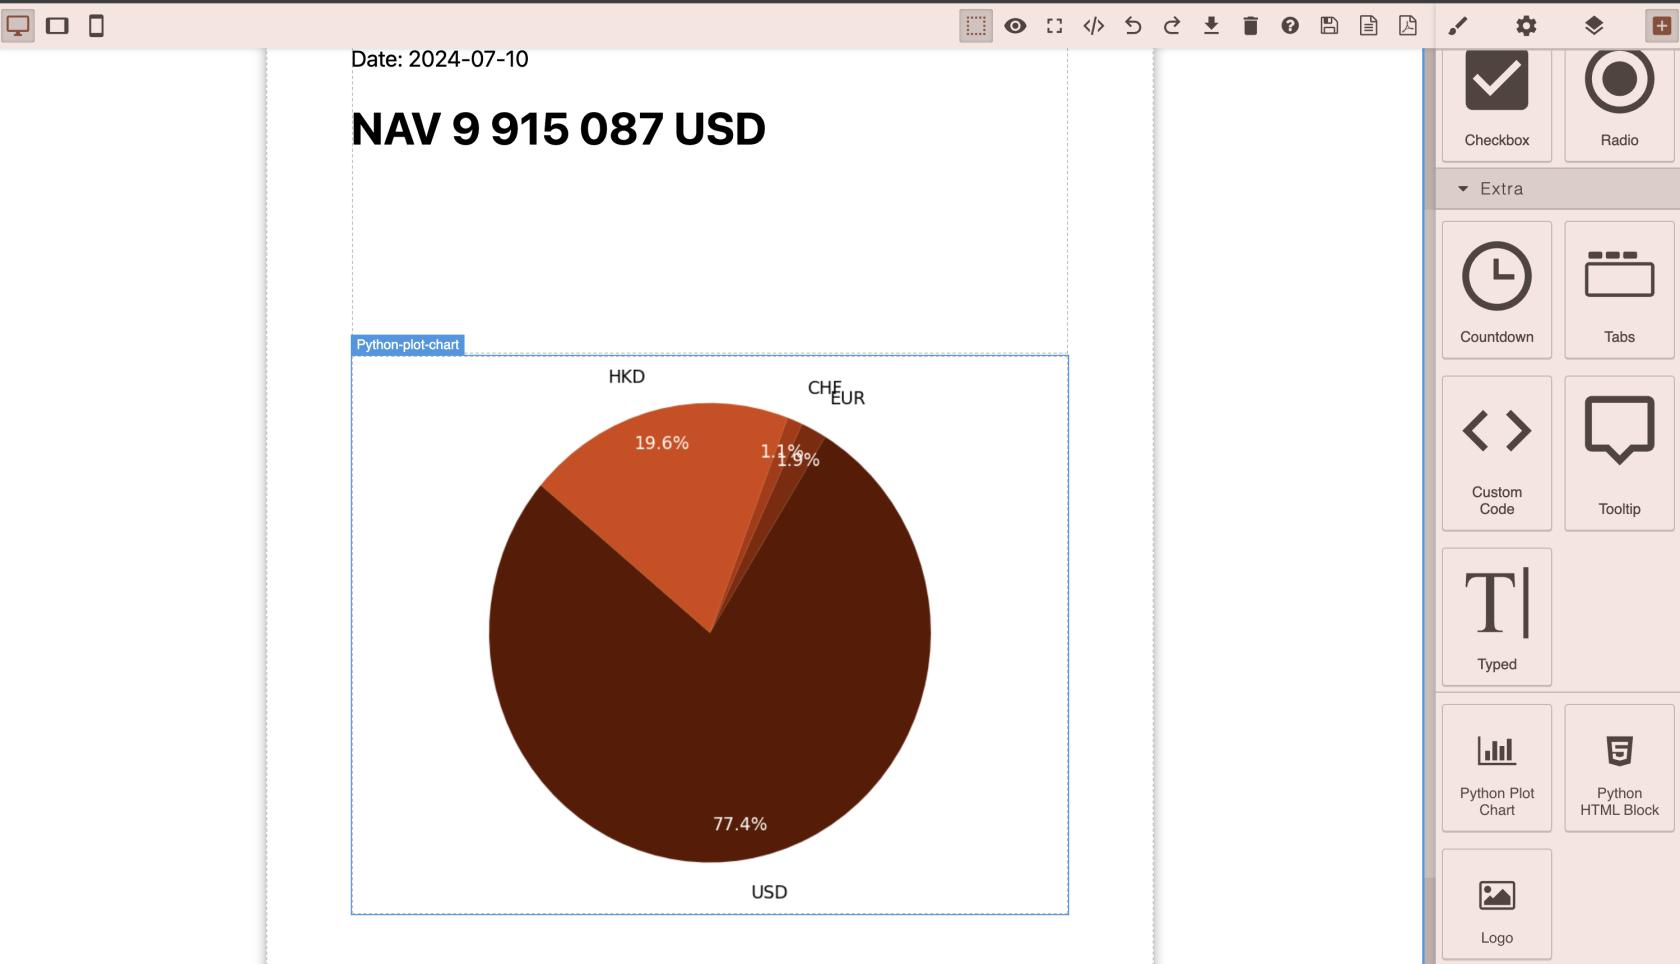](https://docs.finmars.com/uploads/images/gallery/2024-08/screenshot-2024-08-16-at-20-09-16.png)
Logic absolutely the same as with Python HTML Block, the only difference that we expect from Python Plot Chart an **Image** as output
In settings Panel same options and same rules as for Python HTML Block
[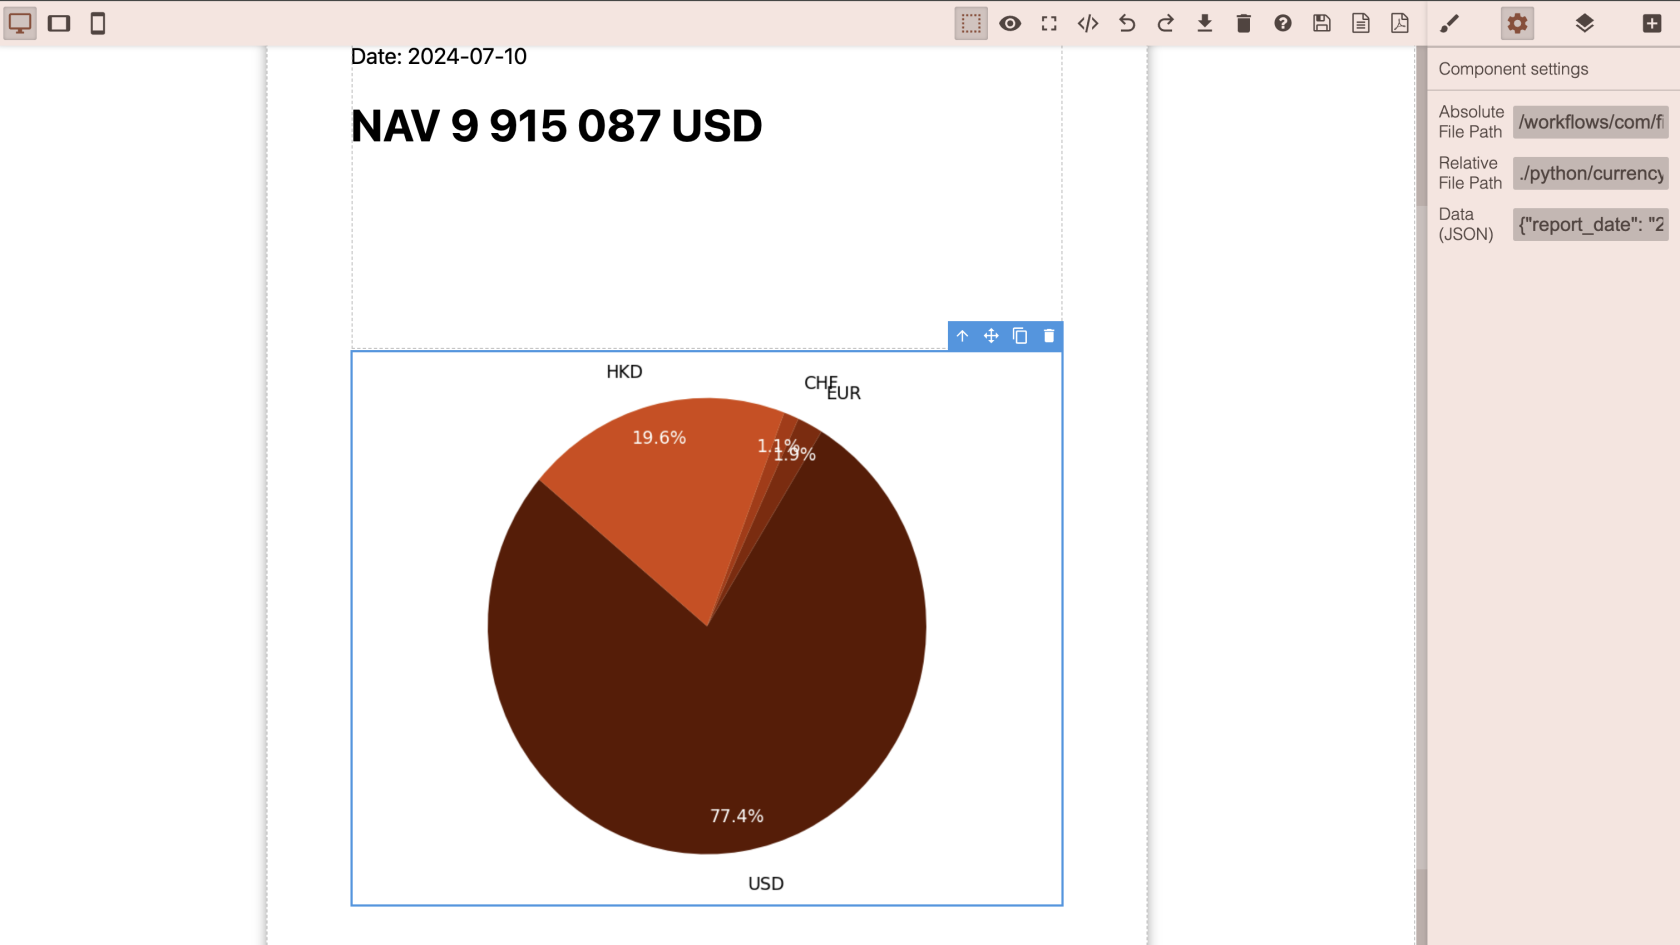](https://docs.finmars.com/uploads/images/gallery/2024-08/screenshot-2024-08-16-at-20-14-28.png)
Lets see what is inside of code. Open ./python/currency\_pie\_chart.ipynb
```python
import matplotlib.pyplot as plt
import requests
import datetime
from datetime import timedelta
from workflow.finmars import utils, request_api
if 'execution_context' not in locals():
execution_context = {}
report_date = execution_context.get('report_date', '2023-08-12')
portfolio = execution_context.get("portfolio", "Bonds Portfolio")
report_currency = execution_context.get('report_currency', 'USD')
pricing_policy = execution_context.get('pricing_policy', 'com.finmars.standard-pricing:standard')
period_type = execution_context.get('period_type', 'ytd')
category_key = 'exposure_currency.user_code'
value_key = 'market_value'
payload = {
"cost_method": 1,
"pricing_policy": pricing_policy,
"report_date": report_date,
"report_currency": report_currency,
"portfolios": [portfolio],
"frontend_request_options": {
"columns": [],
"filter_settings": [],
"groups_types": [],
"groups_values": []
}
}
response = request_api(f'/api/v1/reports/backend-balance-report/items/', method='POST', data=payload)
items = response["items"]
labels = []
sizes_dict = {}
sizes = []
for item in items:
if item[category_key] not in labels:
labels.append(item[category_key])
if item[category_key] not in sizes_dict:
sizes_dict[item[category_key]] = 0
sizes_dict[item[category_key]] = sizes_dict[item[category_key]] + item[value_key]
# print(labels)
# Mock data
# labels = ['USD', "CHF"]
# sizes = [80, 20]
colors = ['#5d1800', '#842400', '#ad3301', '#d5450a', '#f85f26', '#ff8b65']
# print(sizes_dict)
for key, value in sizes_dict.items():
sizes.append(value)
# # Create a pie chart
plt.figure(figsize=(8,6))
wedges, texts, autotexts = plt.pie(sizes, labels=labels, colors=colors, autopct='%1.1f%%', startangle=140, labeldistance=1.15, # Distance of labels from the center of the pie
pctdistance=0.85) # Distance of the percentage text from the center)
for text in texts:
text.set_fontsize(14)
text.set_color('black')
# Set the font size and color for the percentage labels
for autotext in autotexts:
autotext.set_fontsize(14)
autotext.set_color('white')
plt.axis('equal') # Equal aspect ratio ensures that pie is drawn as a circle.
# # Show the plot
plt.tight_layout() # Adjust layout to make room for rotated labels
plt.show()
```
Code is similar to what we have seen before, only principal change is
```python
import matplotlib.pyplot as plt
```
So, we use Matplotlib for charts ([https://matplotlib.org/)](https://matplotlib.org/)) Import it
After we fetched and prepared data, we need to configure our Plot
```python
# Create a pie chart
plt.figure(figsize=(8,6))
wedges, texts, autotexts = plt.pie(sizes, labels=labels, colors=colors, autopct='%1.1f%%', startangle=140, labeldistance=1.15, # Distance of labels from the center of the pie
pctdistance=0.85) # Distance of the percentage text from the center)
for text in texts:
text.set_fontsize(14)
text.set_color('black')
# Set the font size and color for the percentage labels
for autotext in autotexts:
autotext.set_fontsize(14)
autotext.set_color('white')
plt.axis('equal') # Equal aspect ratio ensures that pie is drawn as a circle.
```
Pass data, other settings, when you ready then do:
```python
# Show the plot
plt.tight_layout() # Adjust layout to make room for rotated labels
plt.show()
```
Lets add Export button to your Dashboard Layout. Go to [https://docs.finmars.com/books/pdf-builder/page/add-export-button-to-your-dashboard](https://docs.finmars.com/books/pdf-builder/page/add-export-button-to-your-dashboard)
# Add Export Button to your Dashboard
Here, we found out how to add Export Button that generates PDF and saves it locally on User Device when pressed.
Here is result, on right corner we have block with Export Button
[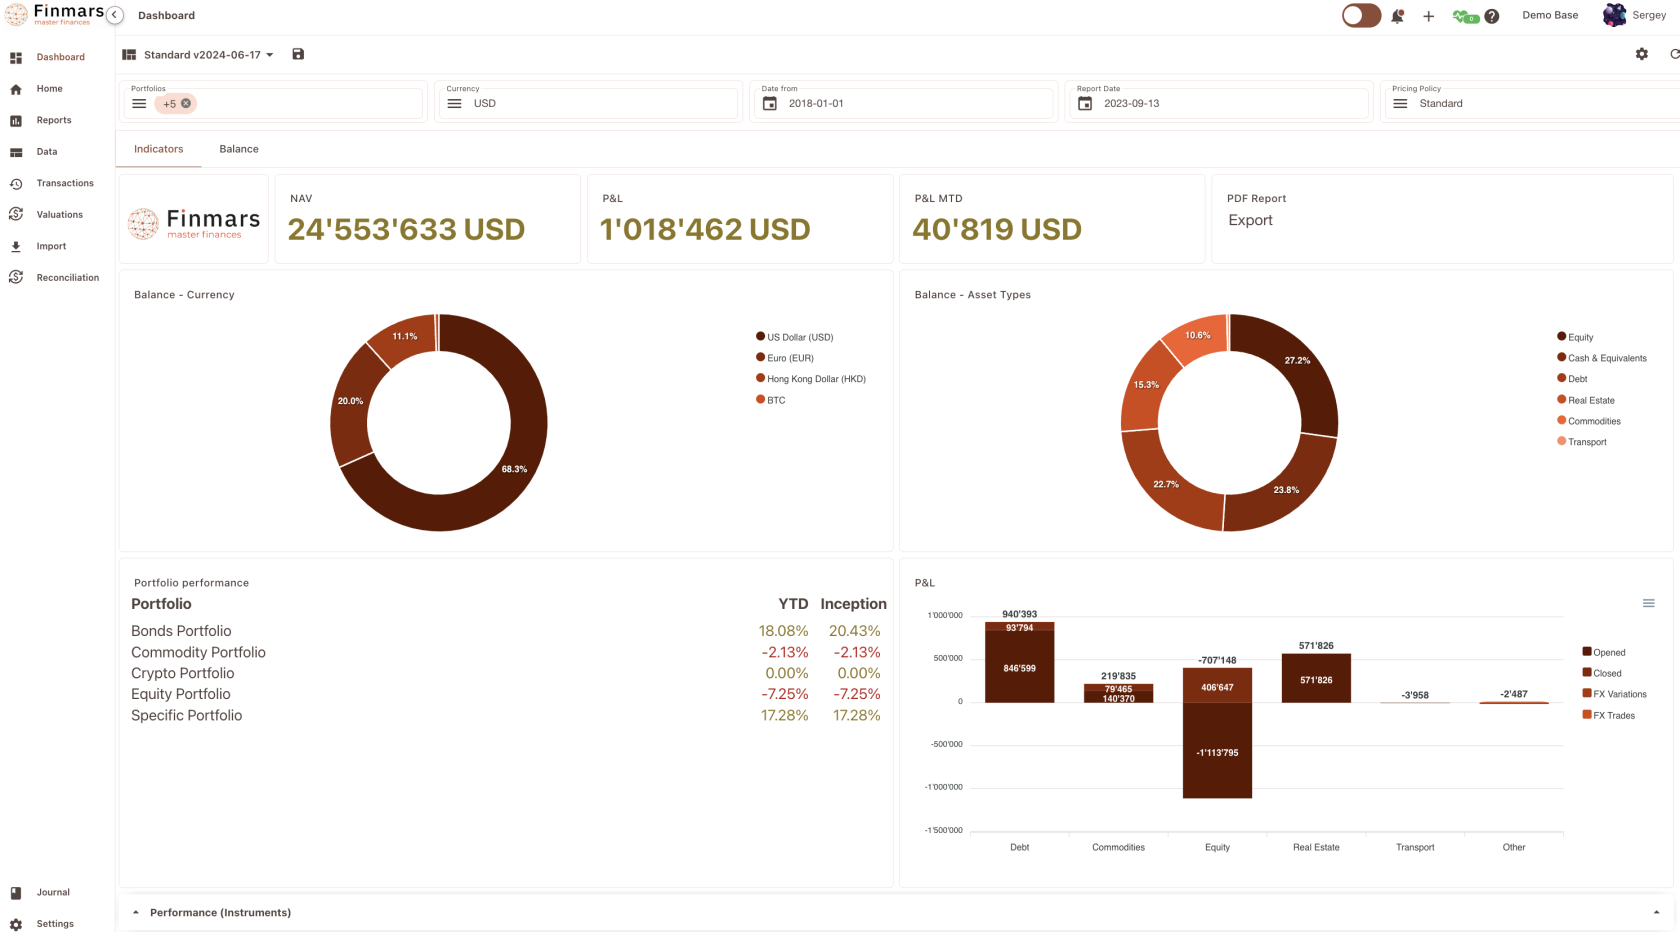](https://docs.finmars.com/uploads/images/gallery/2024-08/screenshot-2024-08-16-at-22-35-03.png)
To achieve that, lets edit Dashboard Layout. Proceed to Edit Dashboard Layout
[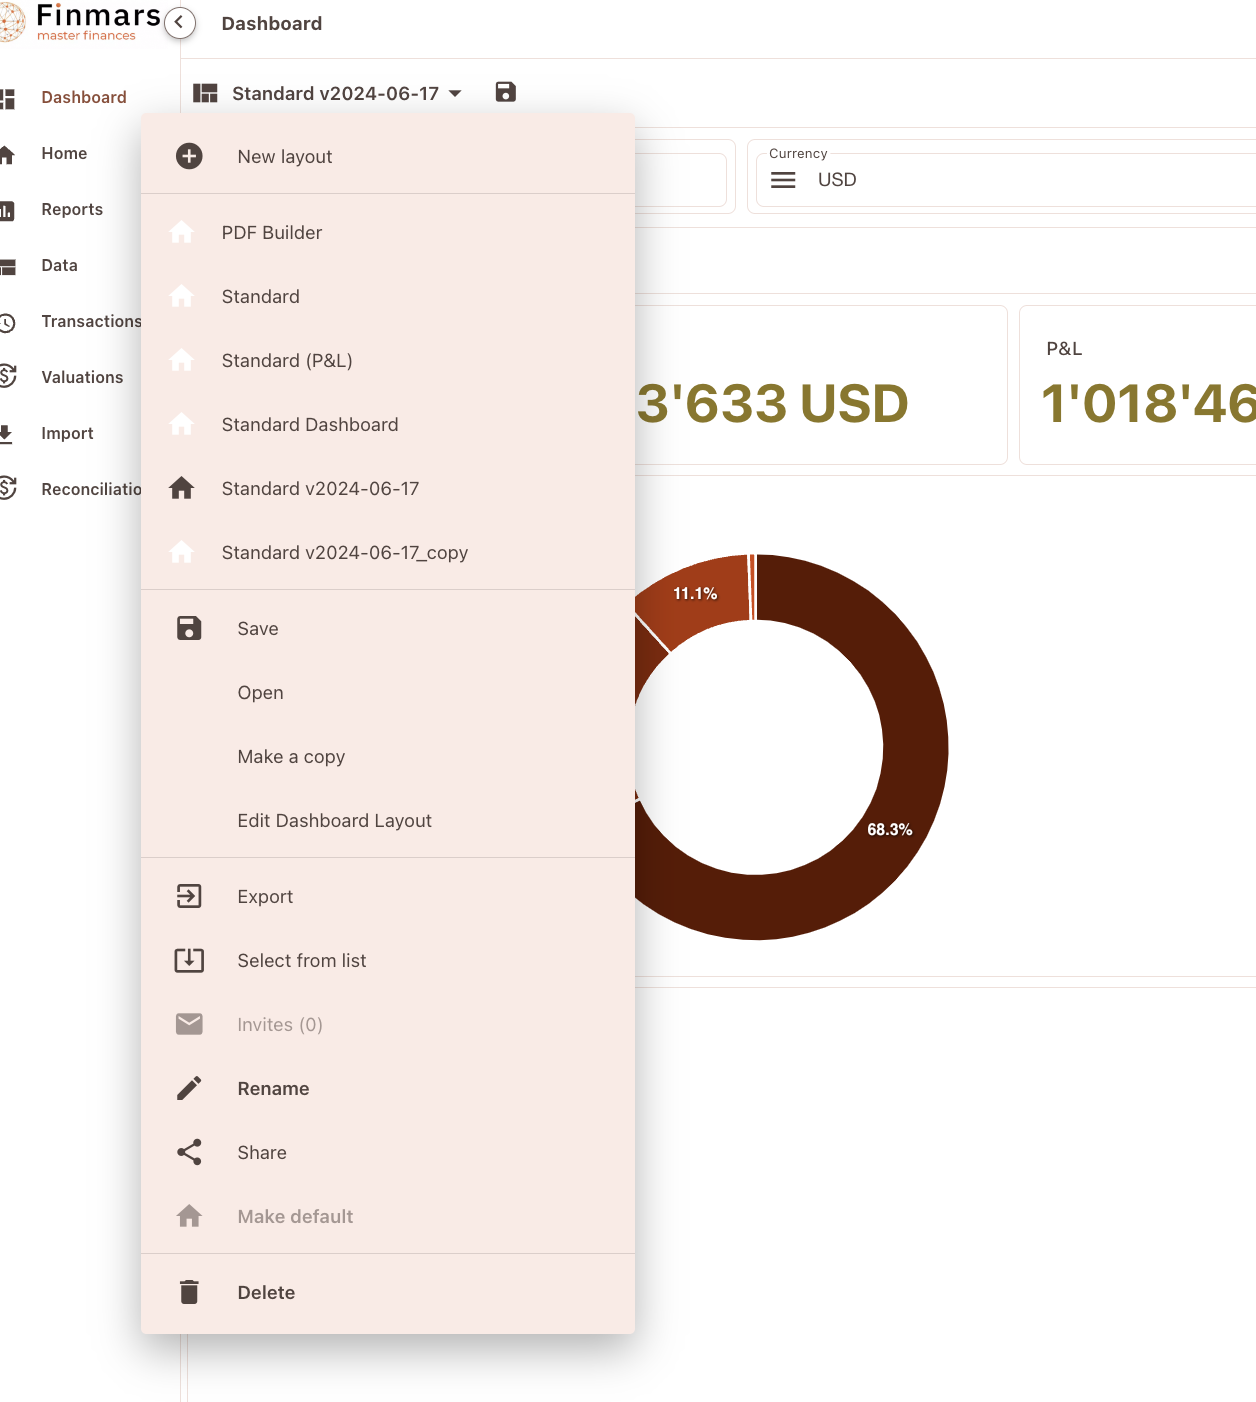](https://docs.finmars.com/uploads/images/gallery/2024-08/screenshot-2024-08-16-at-22-35-48.png)
So here a Dashboard Constructor, press Add New Component
[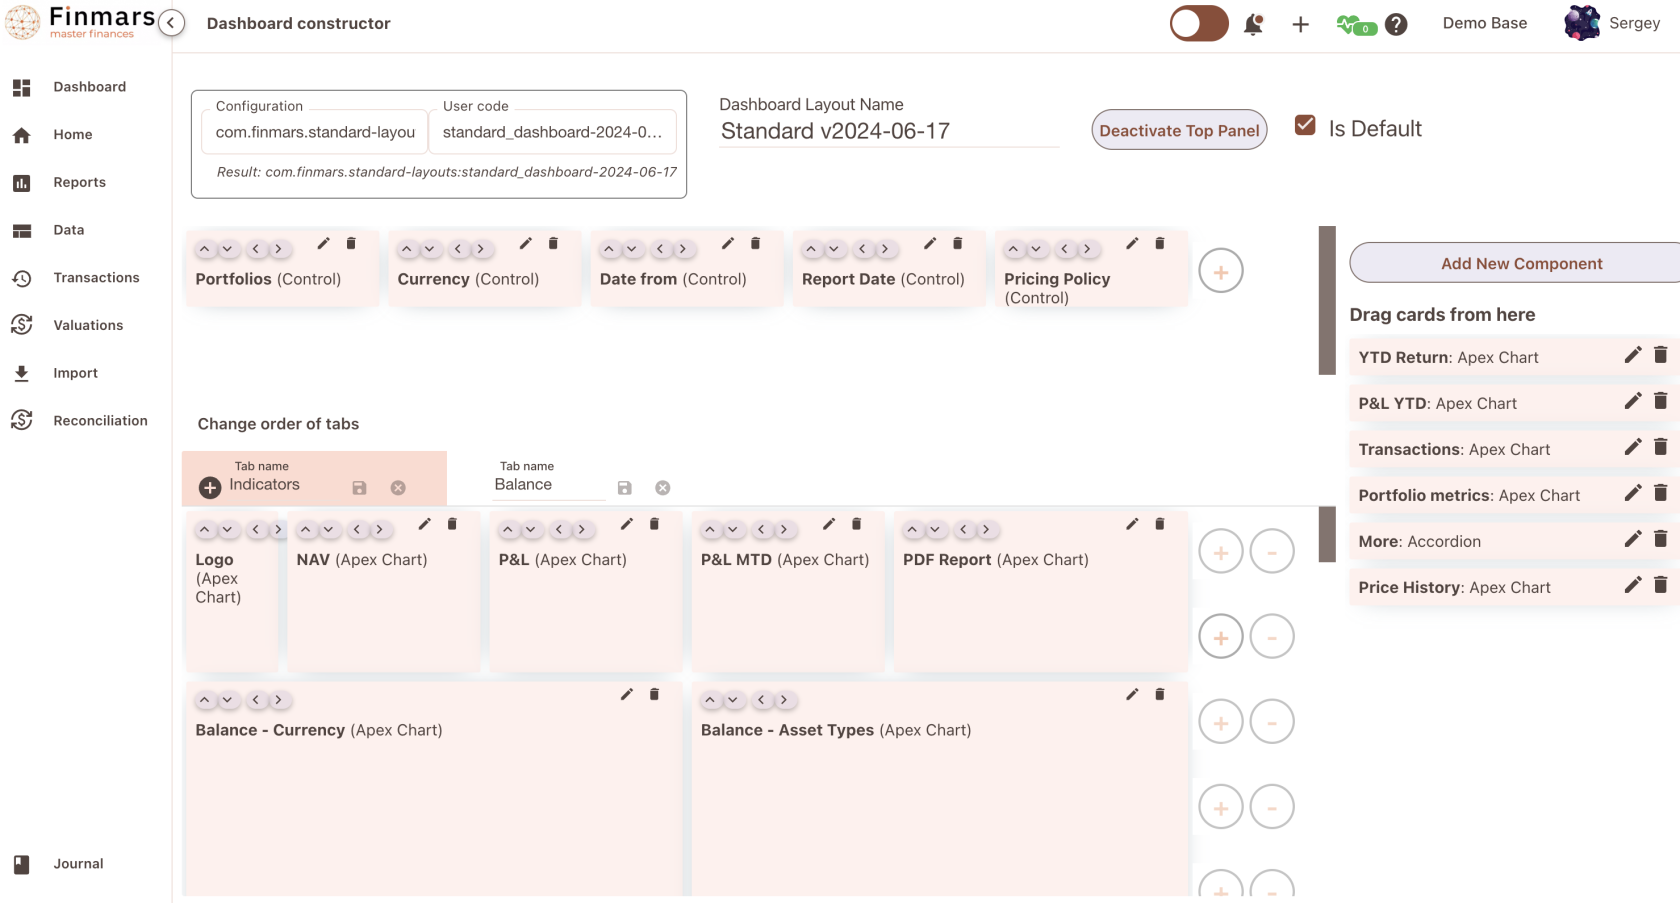](https://docs.finmars.com/uploads/images/gallery/2024-08/screenshot-2024-08-16-at-22-36-27.png)
Add Apex Chart (soon will be renamed to Custom Code Component)
[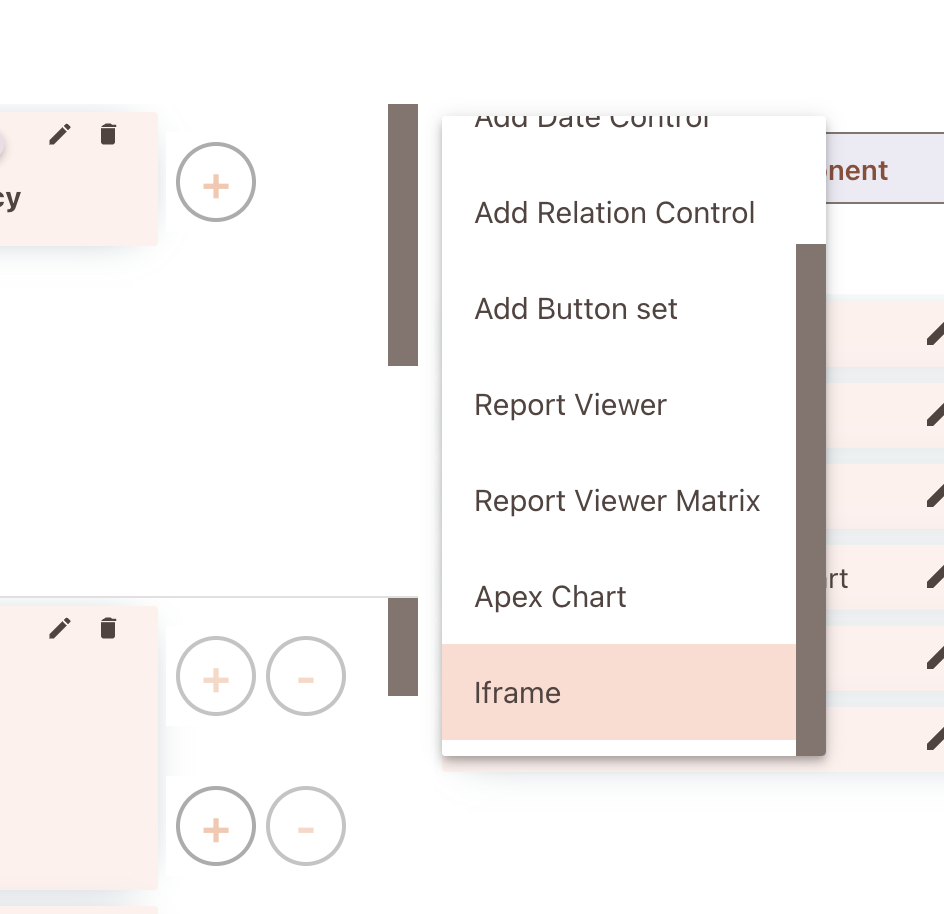](https://docs.finmars.com/uploads/images/gallery/2024-08/screenshot-2024-08-16-at-22-36-55.png)
To make it all work, we borrow code from PDF Builder
```javascript
var selector = '.dashboard-apex-chart-' + scope.vm.componentData.id
var element = document.querySelector(selector);
element.innerHTML = ''
function getCookieValue(name) {
const cookies = document.cookie.split('; '); // Split cookies into array of "name=value"
for (let i = 0; i < cookies.length; i++) {
const cookie = cookies[i].split('='); // Split each "name=value" into [name, value]
if (cookie[0] === name) {
return decodeURIComponent(cookie[1]); // Return the decoded value if the name matches
}
}
return null; // Return null if the cookie is not found
}
element.addEventListener('click', function() {
let currentUrl = window.location.href;
let base_url = window.location.href.split('/a/')[0]
var portfolios = filters.outputs.portfolios || [];
var report_date = filters.outputs.report_date || utils.getYesterdayDate();
var portoflio = 'Bonds Portfolio'
if (filters.outputs.portfolios.length){
portoflio = filters.outputs.portfolios[0]
}
let url_path = '/api/storage/workflows/com/finmars/pdf-builder/example/report.html?report_date='+filters.outputs.report_date+'&portfolio=' + portoflio
// Replace '_builder.html' with '.html' in the URL
let targetUrl = base_url + url_path
fetch(window.location.origin + '/services/pdf-engine/print/', {
method: "POST",
credentials: 'include',
body: JSON.stringify({
"url": targetUrl,
"access_token": getCookieValue('access_token')
}),
headers: {
Accept: 'application/json',
'Content-type': 'application/json'
}
}).then(response => {
if (response.ok) return response.blob();
throw new Error('Failed to generate PDF.');
})
.then(blob => {
// Create a URL for the blob object
const url = window.URL.createObjectURL(blob);
// Create a link element
const a = document.createElement('a');
a.style.display = 'none';
a.href = url;
// Extract filename for the PDF
let baseName = targetUrl.split('/').pop().replace('.html', '').split('?')[0]; // Strip the path and extension
a.download = baseName + '.pdf'; // You can set the default filename here
// Append the link, trigger the download, and remove the link
document.body.appendChild(a);
a.click();
window.URL.revokeObjectURL(url);
document.body.removeChild(a);
})
.catch(error => {
console.error('Error during PDF export:', error);
alert('Error exporting PDF. Check the console for more details.');
});
})
```
Idea is simple, we just add <button> and add Event Listener To it, in Event Listener we make an REST API call to PDF Printer Service (pupeteer)
Things to Consider
```javascript
let url_path = '/api/storage/workflows/com/finmars/pdf-builder/example/report.html?report_date='+filters.outputs.report_date+'&portfolio=' + portoflio
let targetUrl = base_url + url_path
```
We hardcoded url\_path of our report.html
Place instead of it path to your .html PDF report, also provide extra settings if required like
```javascript
?report_date='+filters.outputs.report_date+'&portfolio=' + portoflio
```
Thats it! Now your clients can just press button on dashboard to get .pdf Report
[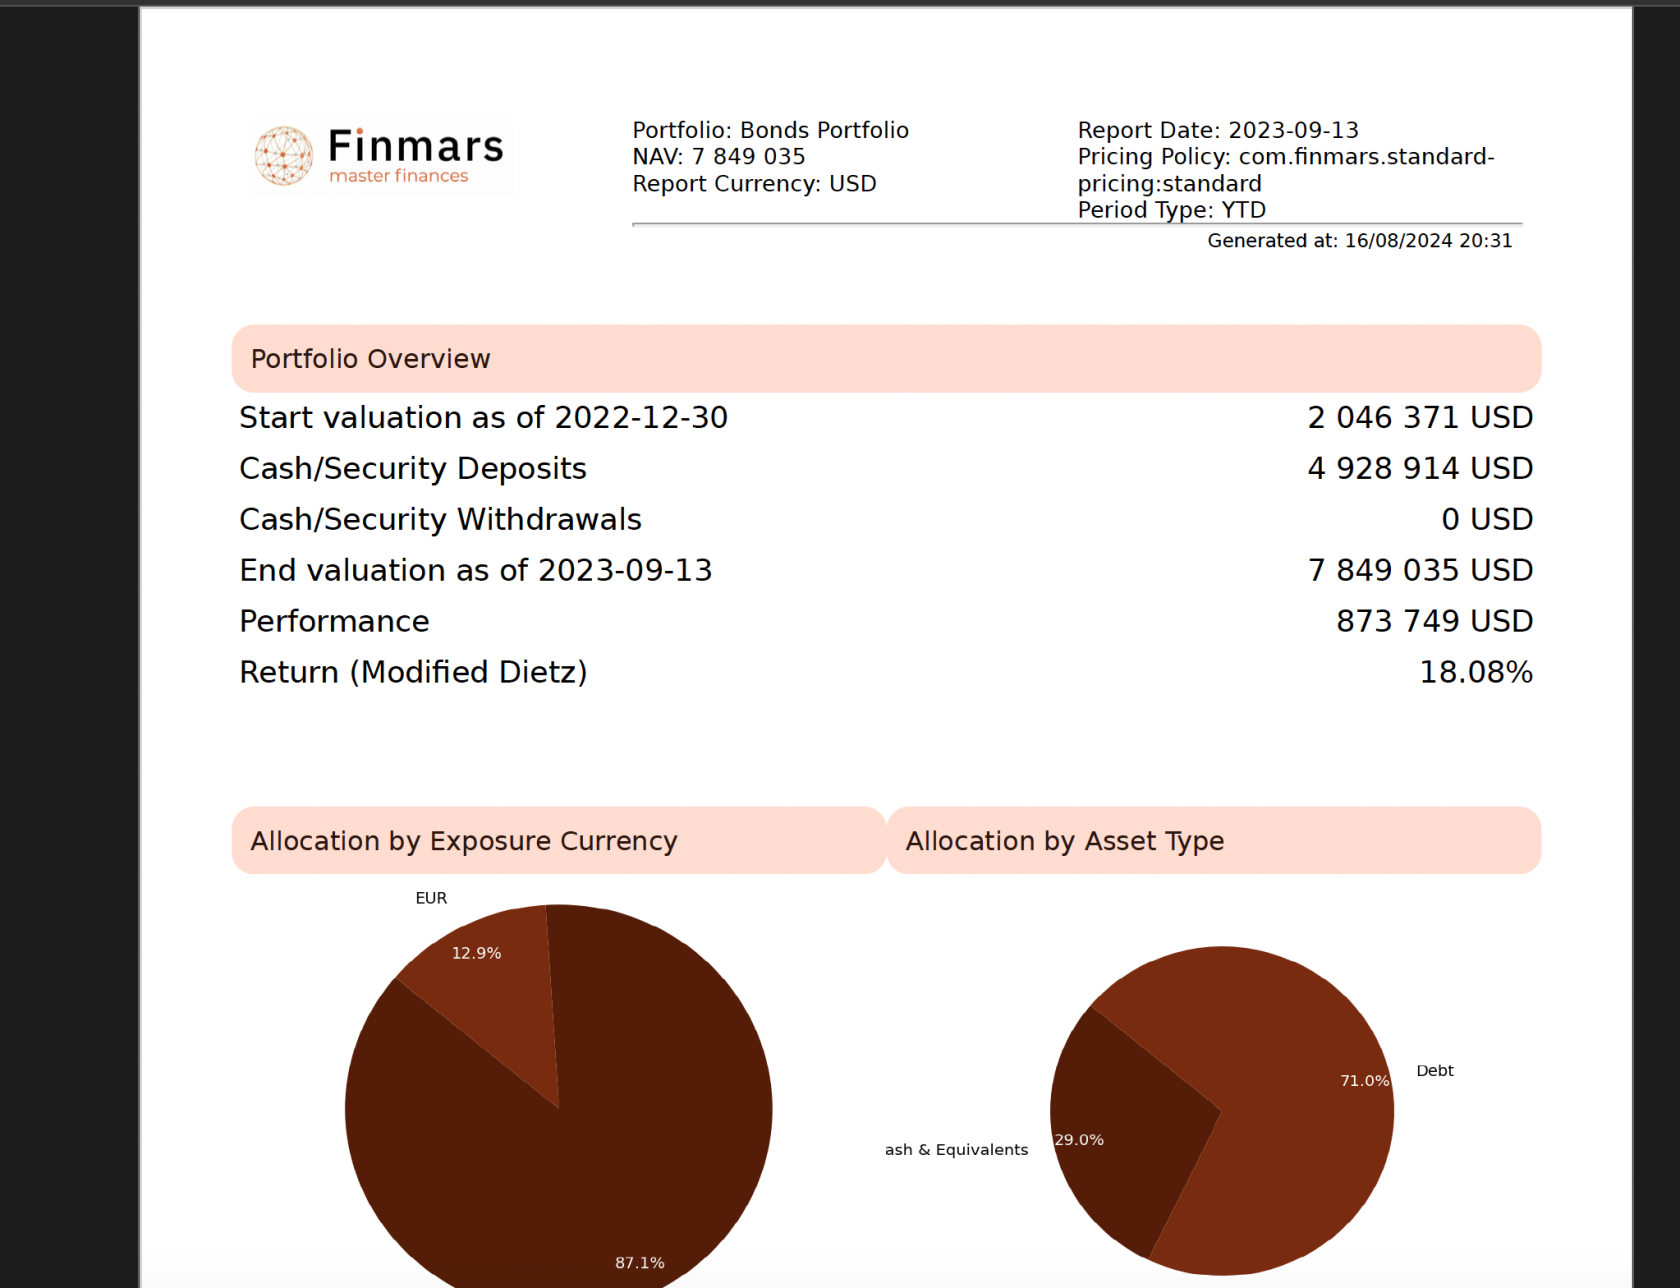](https://docs.finmars.com/uploads/images/gallery/2024-08/screenshot-2024-08-16-at-22-41-36.png)